Tracing
Kiali offers a native integration with two different Distributed Tracing platforms, Jaeger and Grafana Tempo. As such, users can access trace visualizations. But more than that, Kiali incorporates tracing into several correlated views, making your investment in trace data even more valuable.
For a quick glimpse at Kiali tracing features, see below. For a detailed explanation of tracing in Kiali, see this 3-part Trace my mesh blog series. There is a detailed guide to configure access to the different distributed tracing platform, Jaeger and Grafana Tempo.
Access control
Tracing views respect the logged-in user’s namespace access permissions. The tracing backend itself has no access control; Kiali enforces the user’s permissions before returning trace data to the user. To open a trace by its ID, Kiali fetches the trace and then checks the namespaces it participates in: the user must have access to at least one of them for the trace to be returned. Trace lists are scoped the same way: a trace appears in a namespace’s traces, spans and error counts only when the trace passes through that namespace. Authorization is per trace, not per span: once a trace is accessible, all of its spans are shown, including the spans of services in namespaces the user cannot access.
In a multicluster setup, when the tracing telemetry identifies the cluster a trace belongs to, the user must have access to the namespace in that cluster; traces whose telemetry does not identify a cluster are checked against the namespace name in any cluster. The cluster match uses Kiali’s cluster names, which must match the Istio cluster IDs — see the multi-cluster configuration page before overriding cluster names.
A trace must carry namespace information in its telemetry for Kiali to
show it: Kiali reads the istio.namespace, istio.source_namespace,
istio.destination_namespace and k8s.namespace.name span attributes
(and the node_id of sidecar spans). Traces whose spans carry none of
these cannot be authorized for any user and are excluded from the tracing
views. The service.namespace attribute is not read for authorization:
it is a logical service grouping controlled by the application, not the
Kubernetes namespace the span was produced in. Istio mesh telemetry
carries the namespace attributes; spans emitted directly by applications
through an OpenTelemetry collector may not — configure the collector’s
k8sattributes processor to set k8s.namespace.name on those spans so
their traces remain visible.
Workload detail
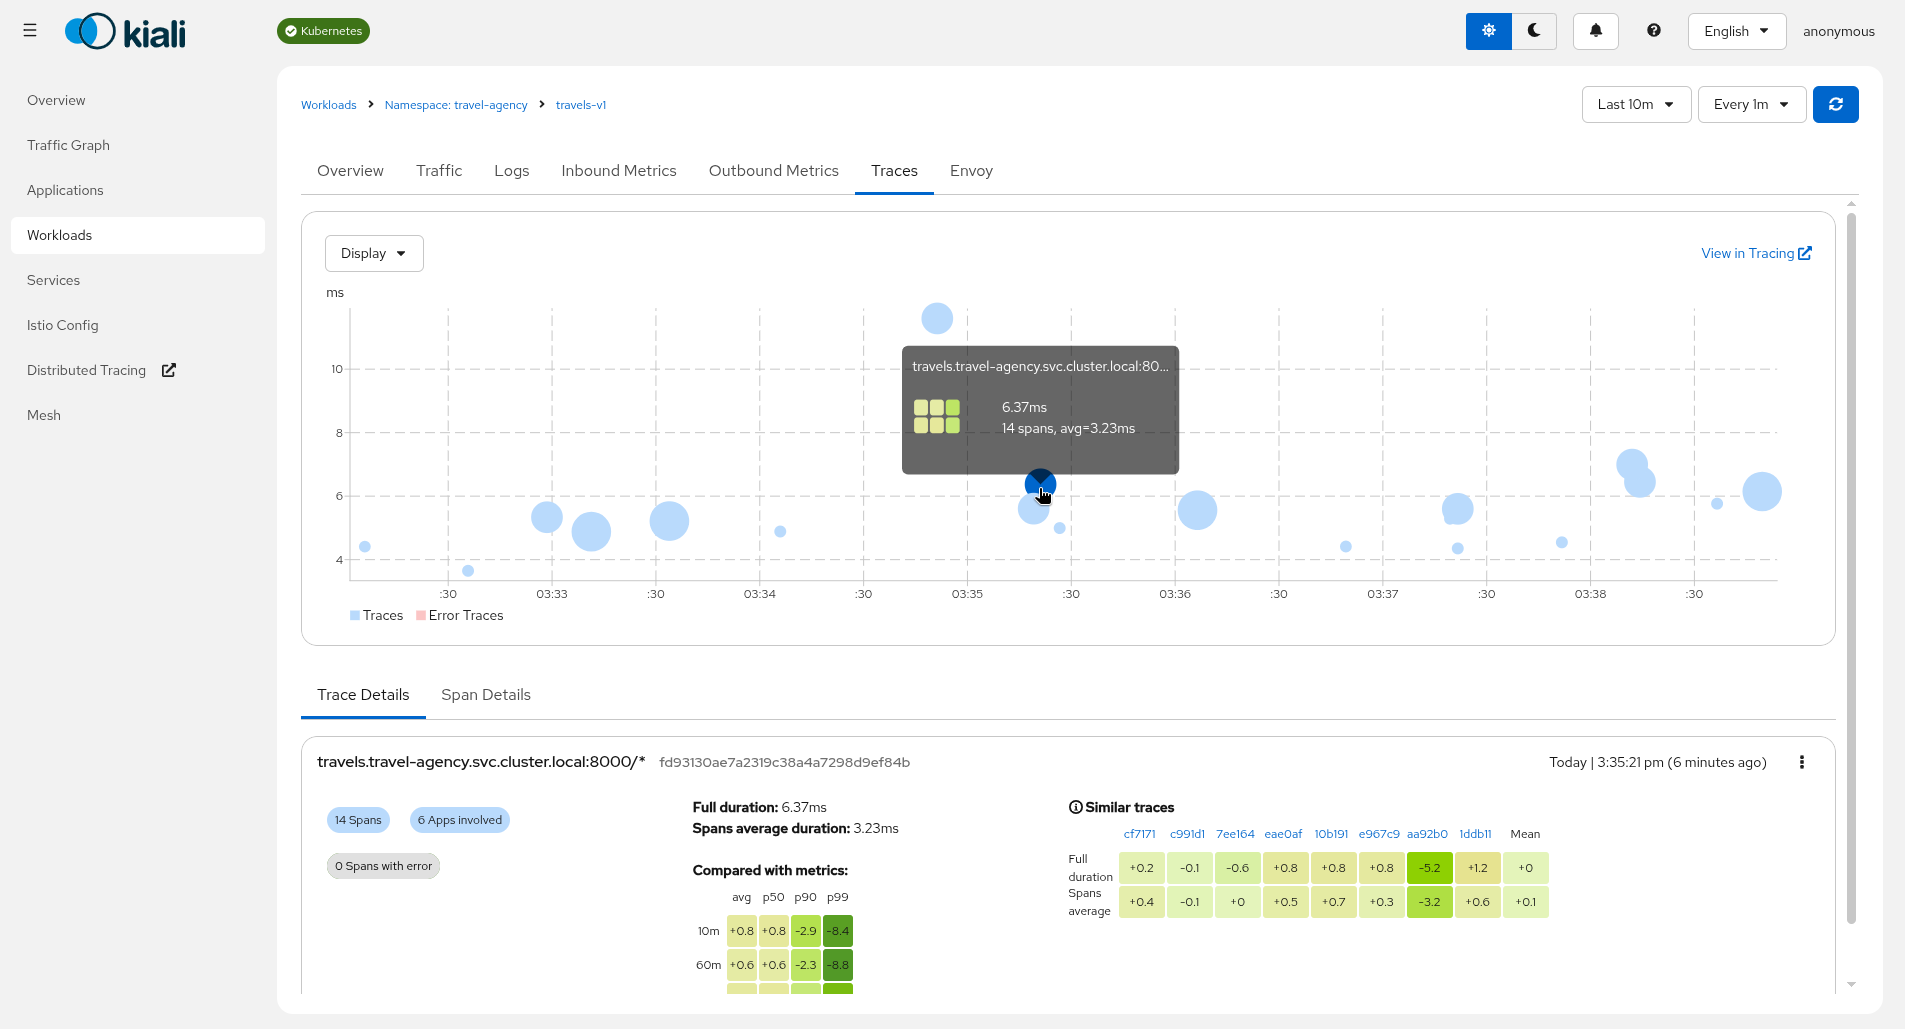
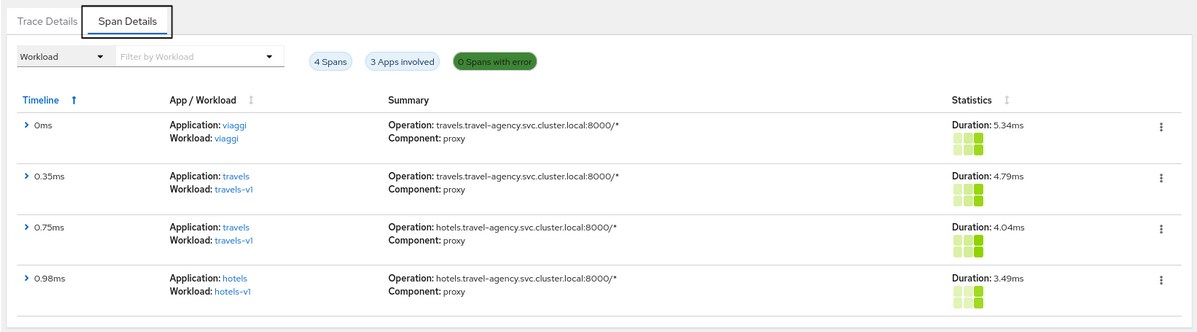
When investigating a workload, click the Traces tab to visualize your traces in a chart. When selecting a trace Kiali presents a tab for trace detail, and a tab for span details. Kiali always tries to surface problem areas, Kiali uses a heatmap approach to help the user identify problem traces or spans.
Heatmaps
A heatmap that you see in the Workload’s Tracing tab is a matrix that compares a specific trace’s request duration against duration metrics aggregated over time.
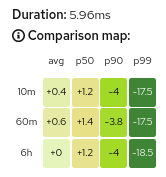
Each trace has a corresponding heatmap matrix. Each cell in the matrix corresponds to a specific metric aggregate; the value and color of a cell represents the difference between that metric and the duration of the matrix’s associated trace.
For example, the top-right cell of the heatmap above shows that the duration of the request represented by the trace (5.96ms) was 17.5ms faster than the 99th percentile of all inbound requests to the workload within the last 10 minutes.
The color of a cell will range between red and green; the more green a cell is, the faster the duration of the trace was compared to the aggregate metric data. A red cell indicates the associated trace was much slower compared to the aggregate metric data and so examining that trace could help detect a potential bottleneck or problem.
Metric Correlation
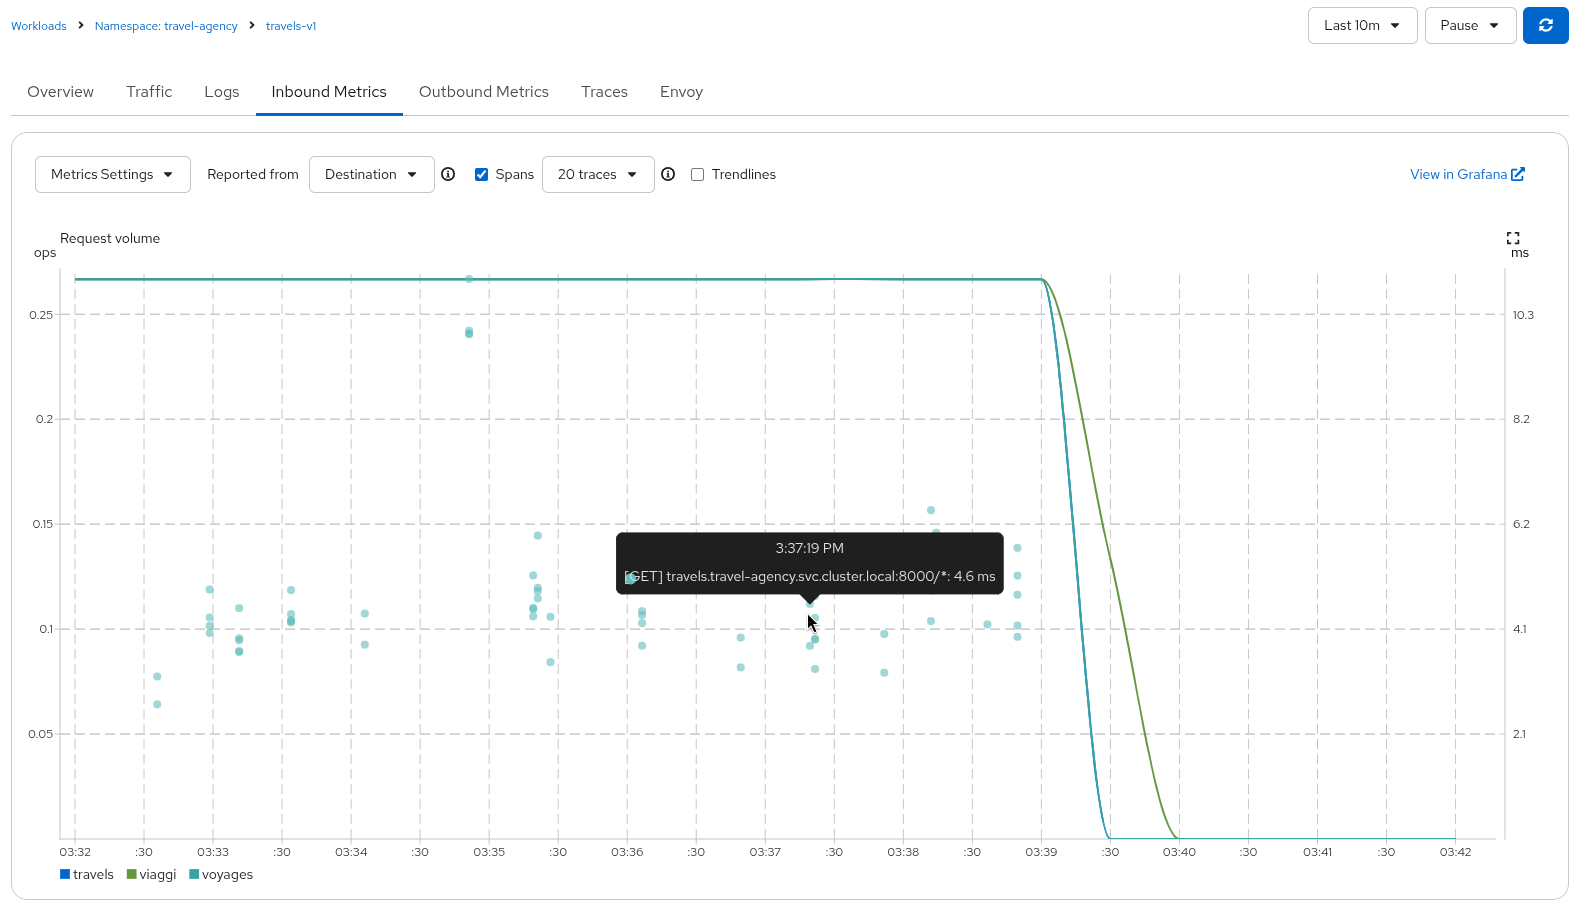
Kiali offers span overlays on Metric charts. The user can simply enable the spans option to generate the overlay. Clicking any
span will navigate back to the Traces tab, focused on the trace of interest.
Graph Correlation
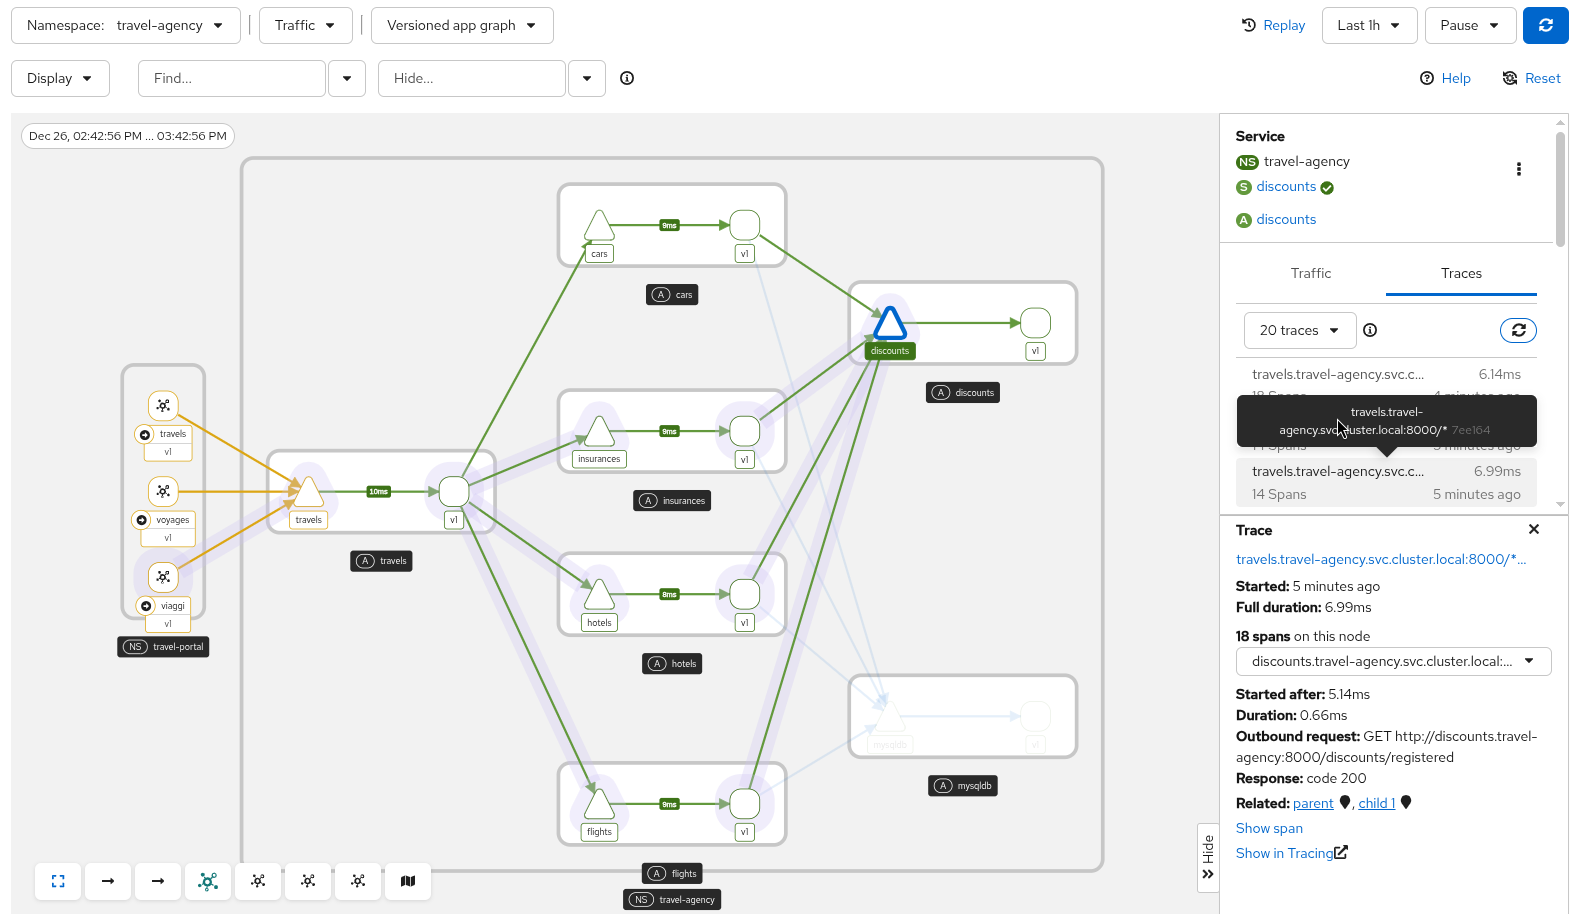
Kiali users often use the Graph Feature to visualize their mesh traffic. In the side panel, When selecting a graph node, the user will be presented with a Traces tab, which lists available traces for the time period. When selecting a trace the graph will display an overlay for the trace’s spans. And the side panel will display span details and offer links back to the trace detail views.
Logs Correlation
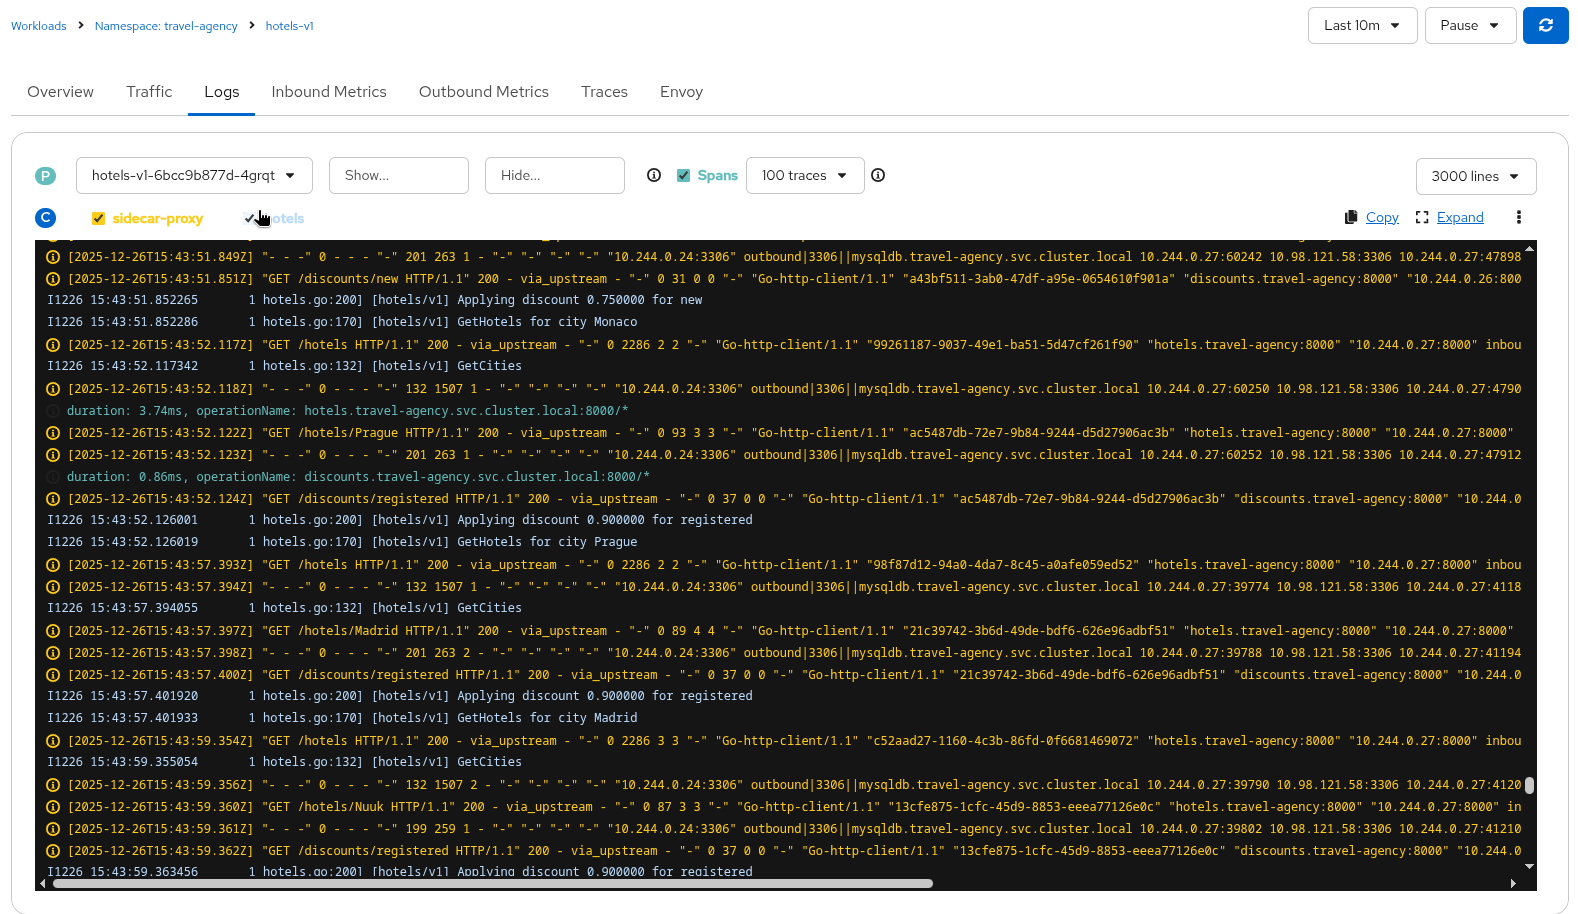
Kiali works to correlate the standard pillars of observability: traces, metrics and logs. Kiali can present a unified view of
log and trace information, in this way letting users use logs to identify traces of interest. When enabling the spans option
Kiali adds trace entries to the workload logs view. Below, in time-sorted order, the user is presented with a unified view of application
logs (in white), Envoy proxy logs (in gold), and trace spaces (in blue). Clicking a span of interest brings you to the detail
view for the trace of interest.