OSSMC User Guide
The OpenShift Service Mesh Console (OSSMC) is an extension to the OpenShift Console which provides visibility into your Service Mesh. With the OSSMC plugin installed, a new Service Mesh menu category is available in the navigation menu on the left side of the web console, providing dedicated list and detail pages for all mesh components. In addition, new Service Mesh tabs enhance the existing Workloads, Services, Projects, and Istio configuration OpenShift console detail pages.
The features of the OSSMC plugin are the same as those of the standalone Kiali Console, but the pages are organized differently to better integrate with the OpenShift console. The OSSMC plugin does not replace the Kiali Console, and after installing the OSSMC plugin, you can still access the standalone Kiali Console. This User Guide, however, will discuss the extensions you see from within the OpenShift Console itself.
Service Mesh Navigation
The OSSMC plugin adds a Service Mesh category to the OpenShift Console sidebar with the following pages:
- Overview — Namespace summary with health and metric cards
- Traffic Graph — Full mesh topology view
- Mesh — Istio infrastructure status
- Namespaces — Namespace list with health, labels, and detail links
- Applications — Application list with a dedicated detail page
- Services — Service list with detail pages
- Workloads — Workload list with health, type, and Istio configuration
- Istio Config — Istio configuration list with validation status
All of these pages are standalone routes within the OSSMC plugin, providing a consistent Kiali-powered experience without leaving the OpenShift Console context.
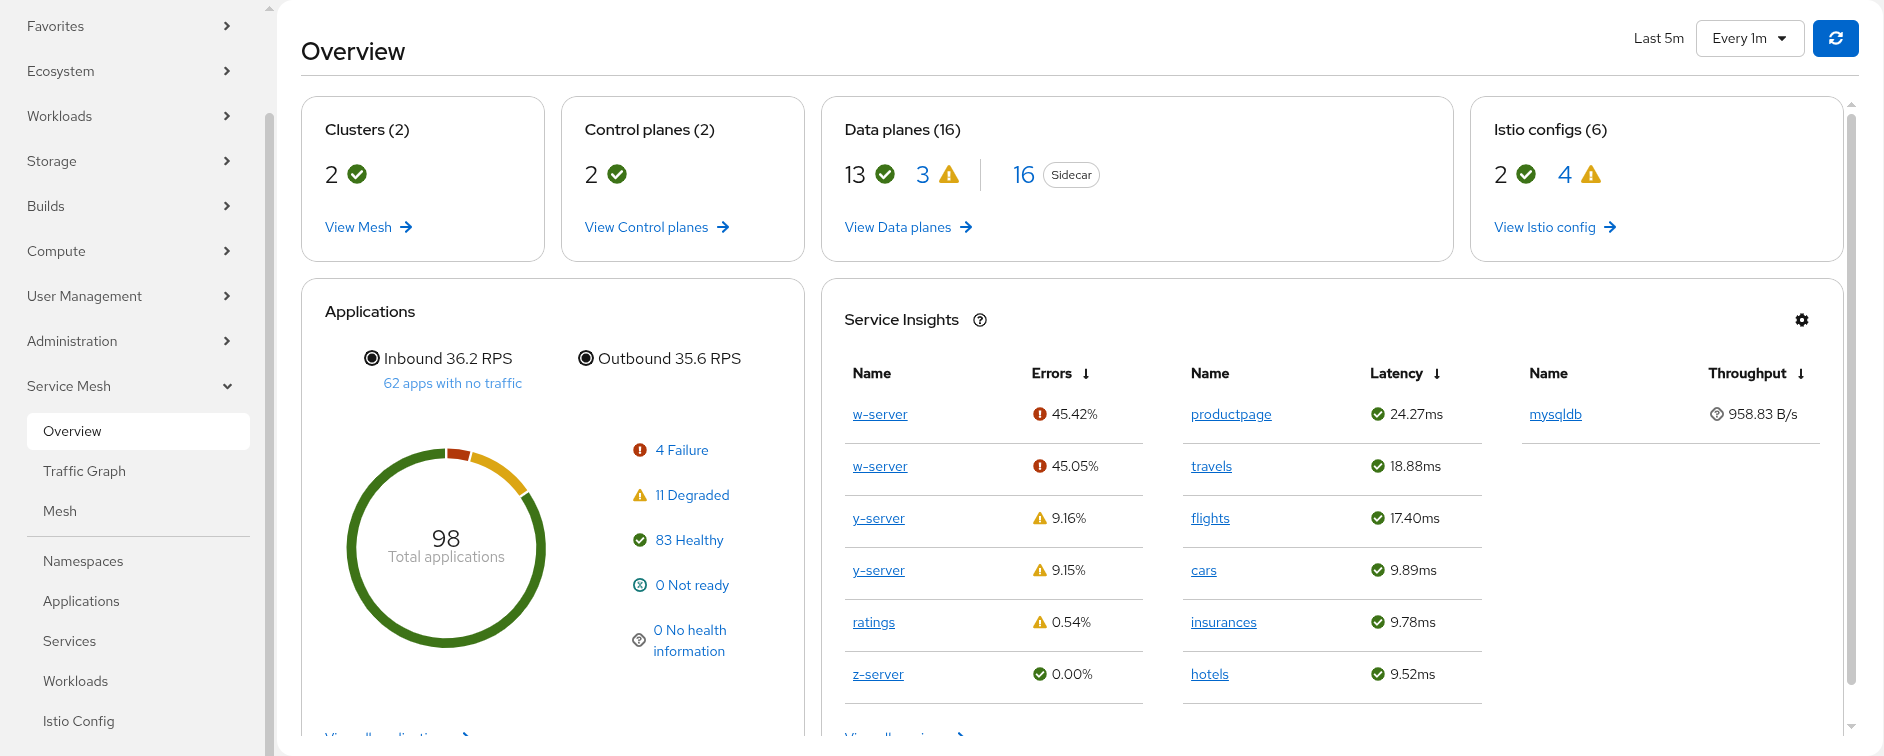
Overview
The Overview page provides a summary of your mesh by showing cards representing the namespaces participating in the mesh. Each namespace card has summary metric graphs and additional health details. There are links in the cards that take you to other pages within OSSMC.
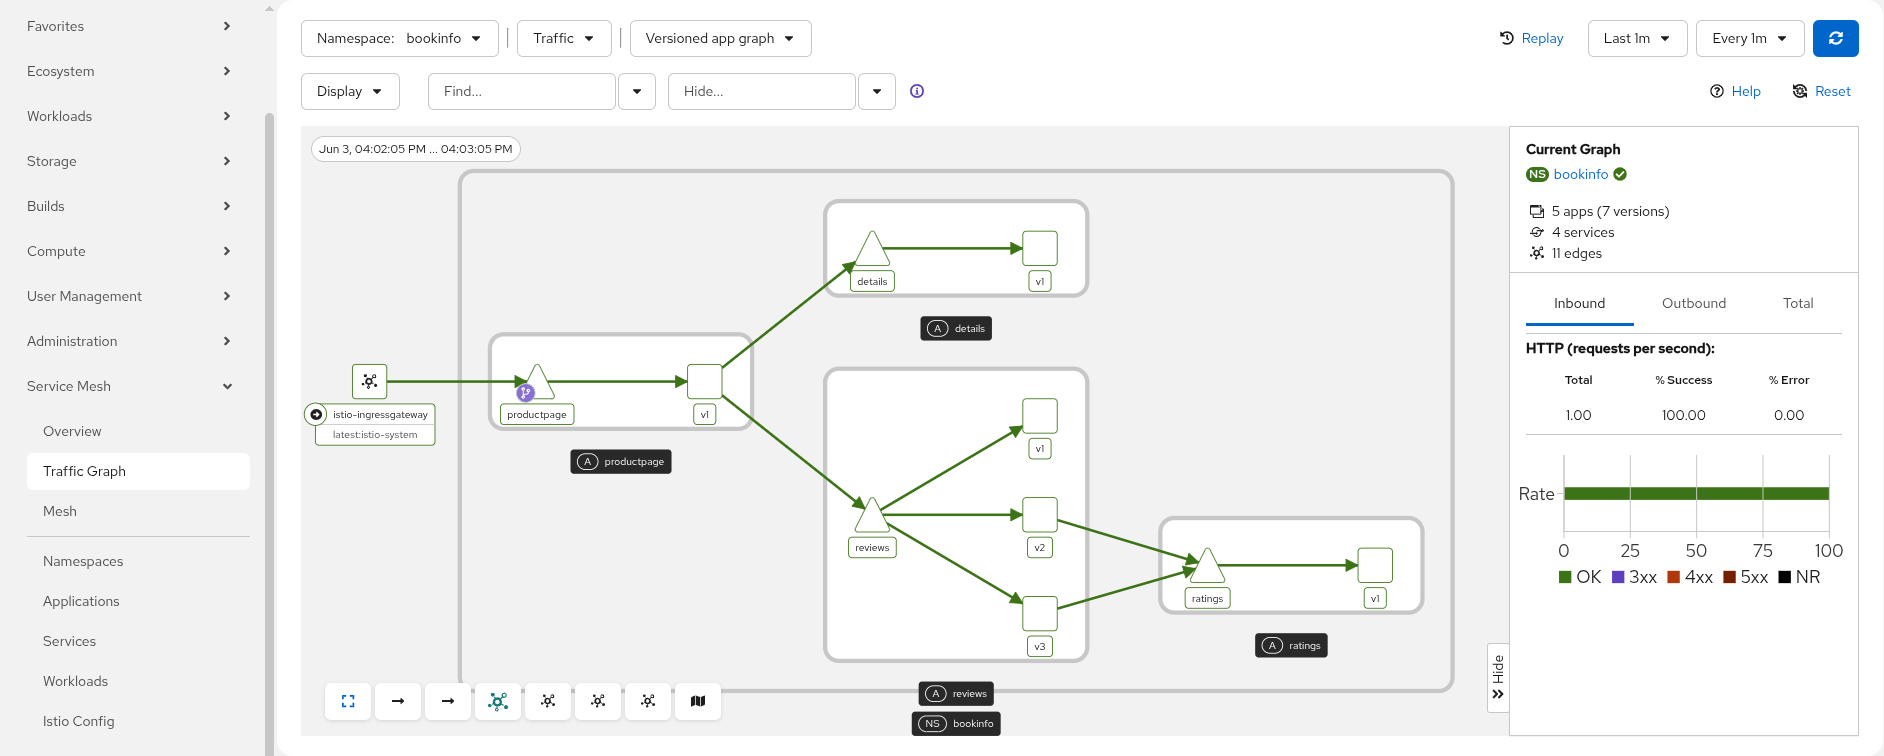
Traffic Graph
The Traffic Graph page provides the full topology view of your mesh. The mesh is represented by nodes and edges — each node representing a component of the mesh and each edge representing traffic flowing through the mesh between components.
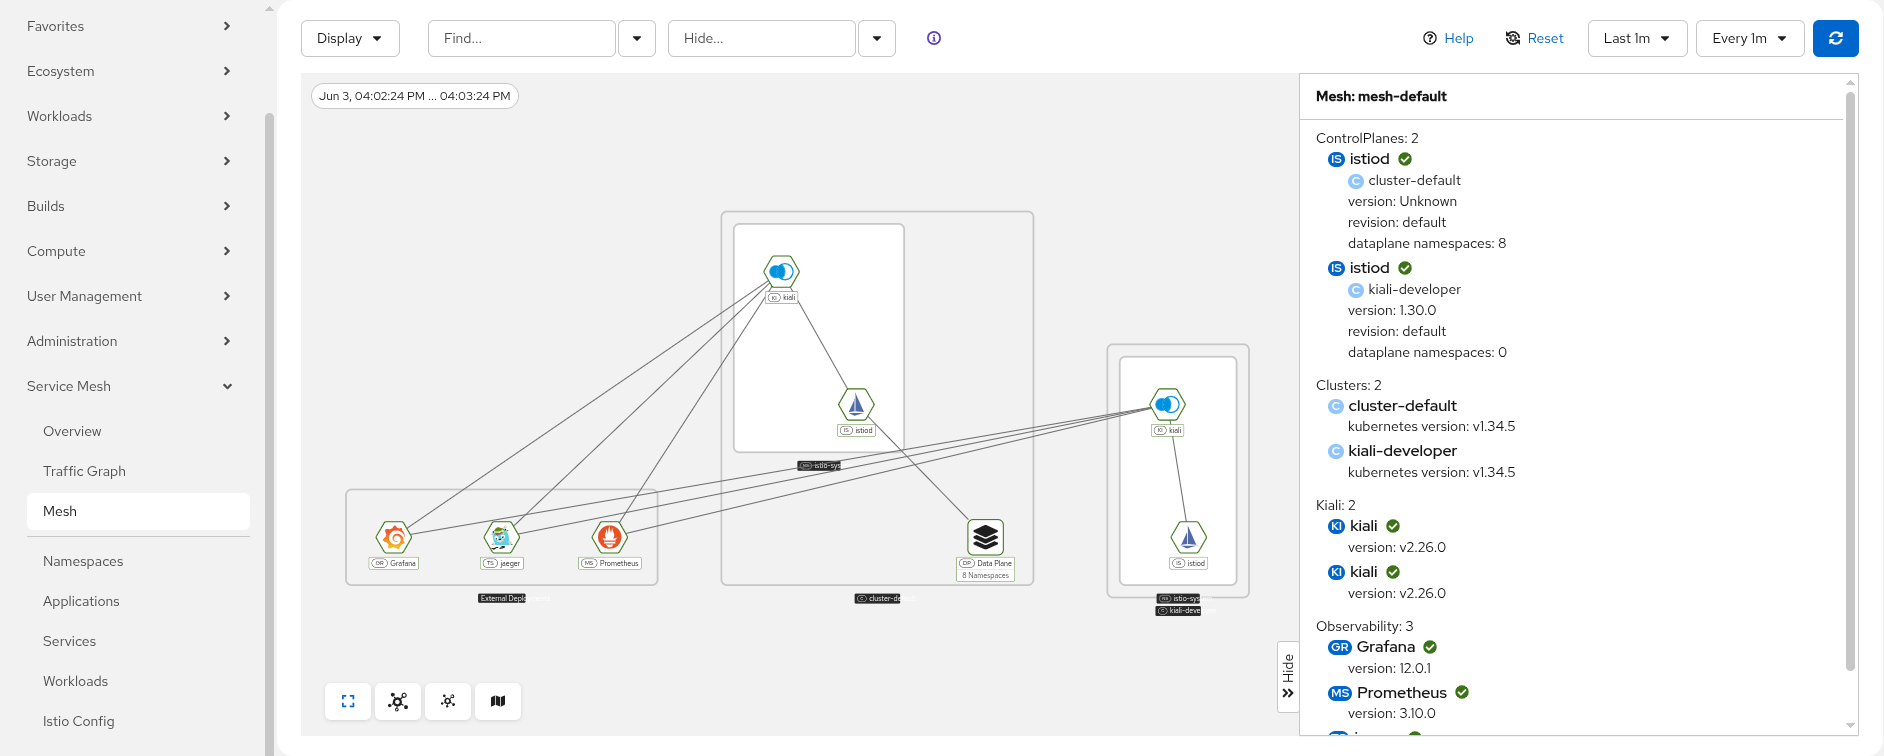
Mesh
The Mesh page provides detailed information about the Istio infrastructure status. It shows an infrastructure topology view with core and add-on components, their health, and how they are connected to each other.
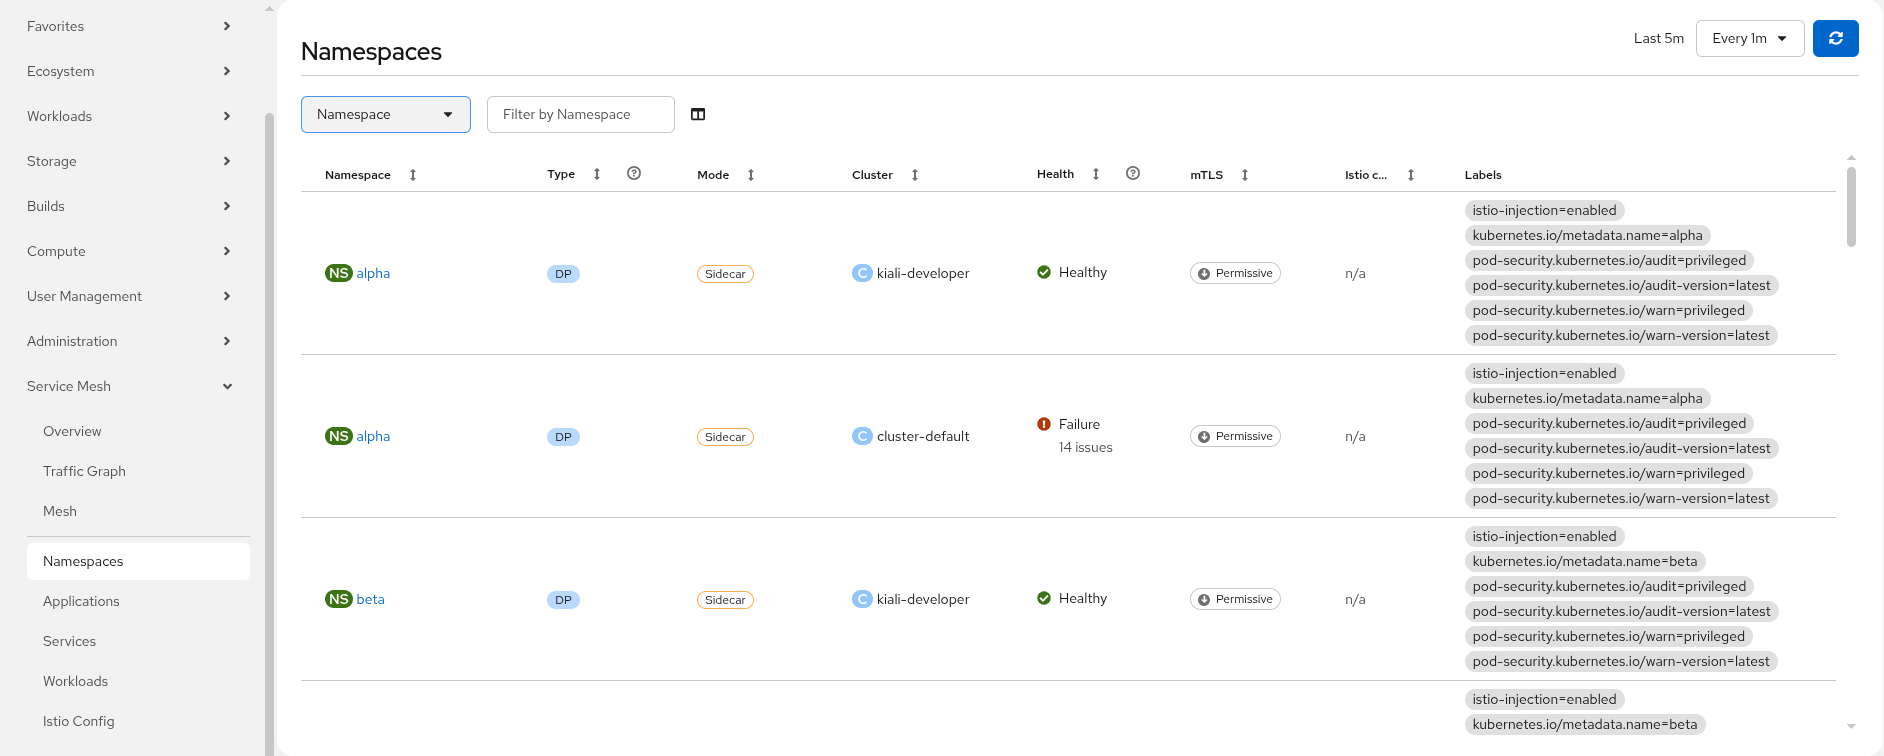
Namespaces
The Namespaces page provides a list of namespaces participating in the mesh along with their health status and labels. Clicking a namespace opens a detail page with a split-panel layout: the left panel contains stacked cards showing namespace attributes, resource links, and health information, while the right panel displays a namespace-scoped traffic minigraph.
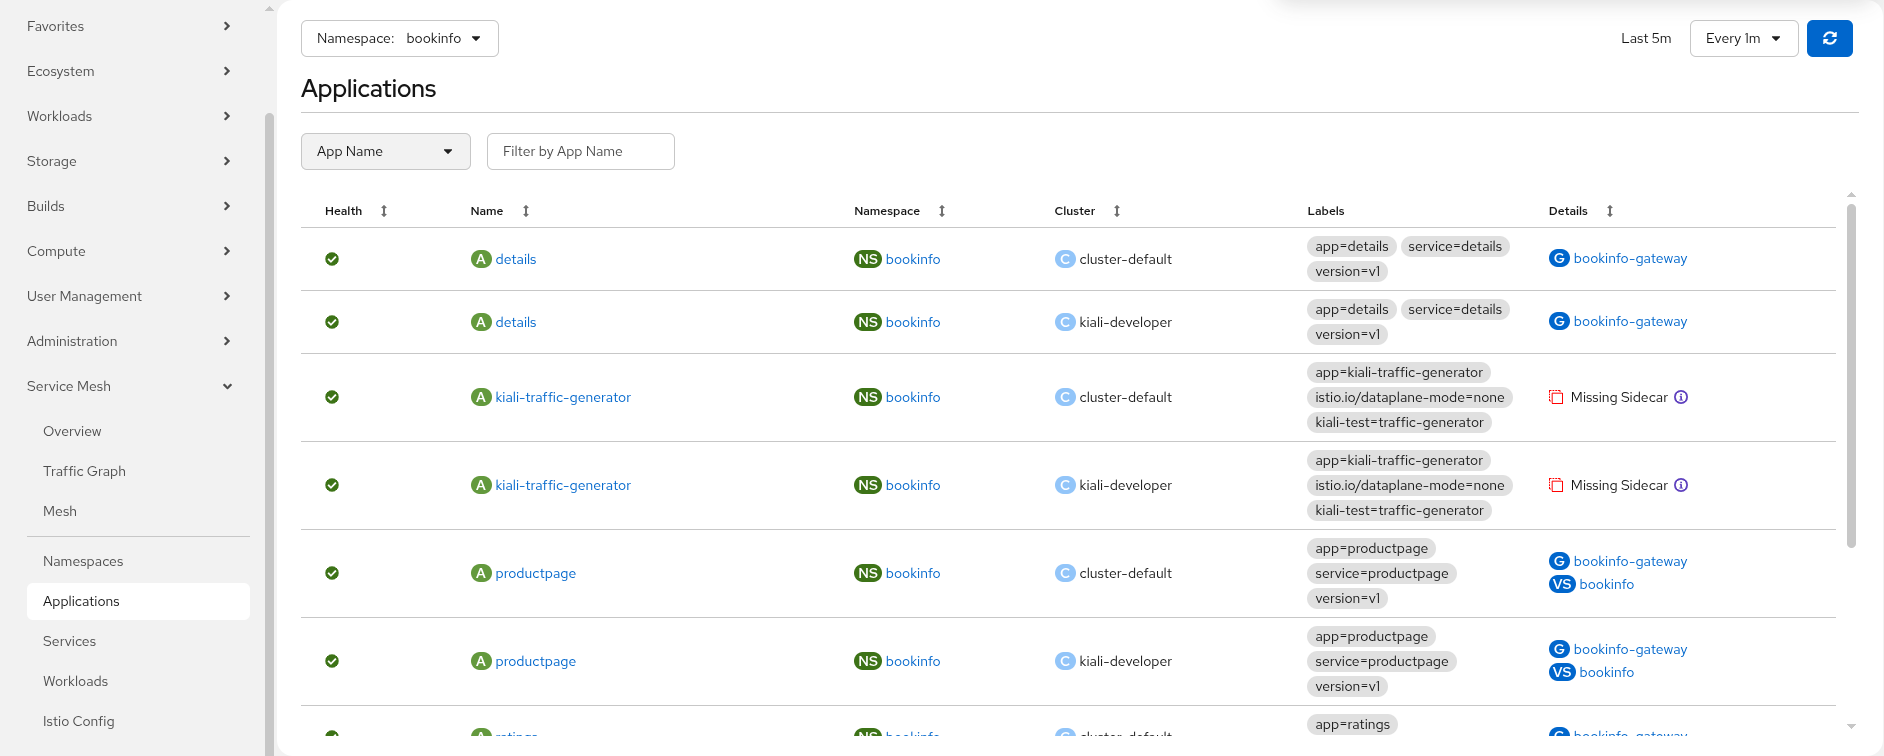
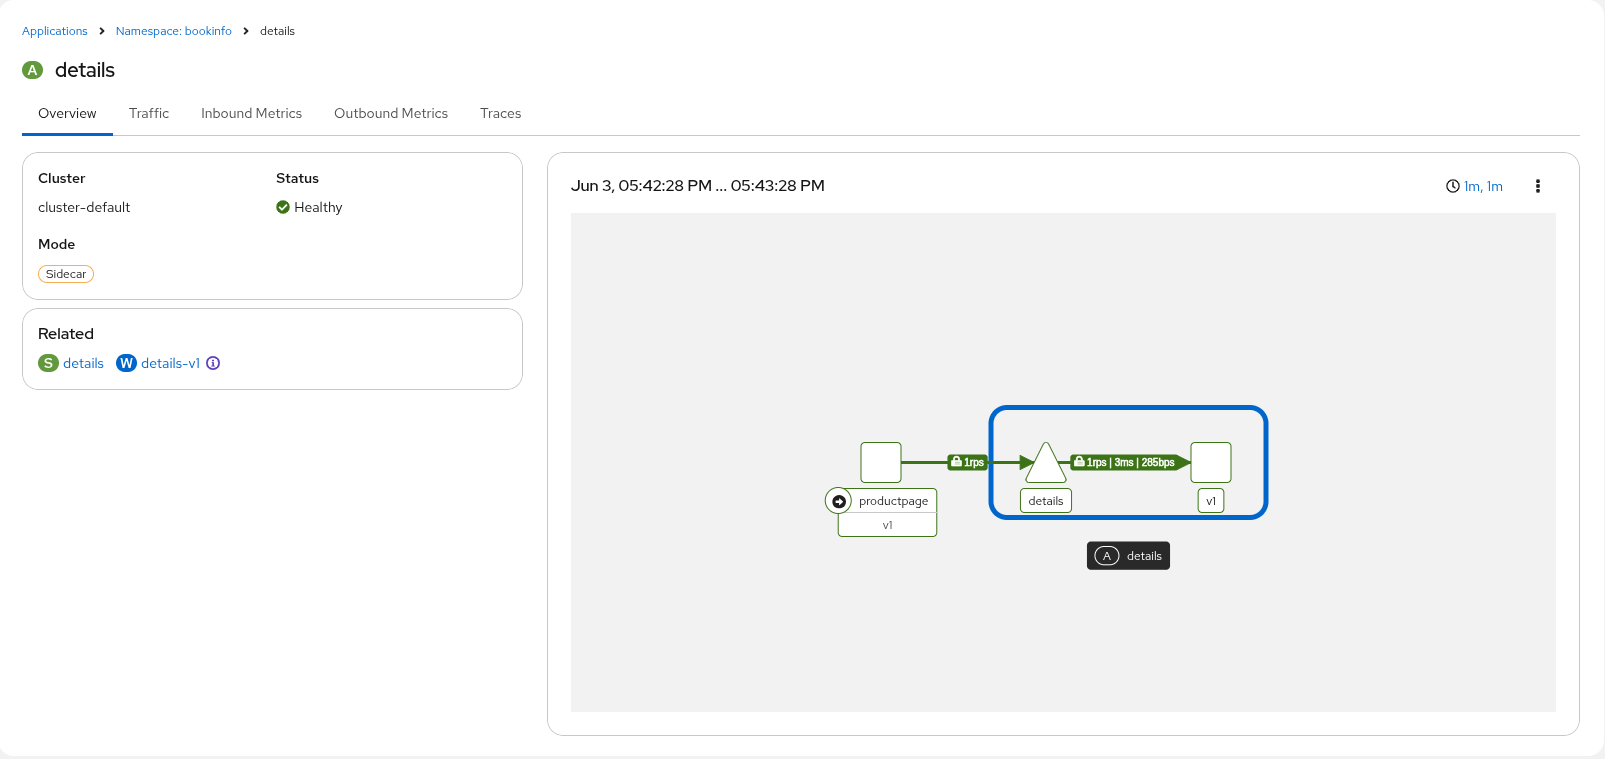
Applications
The Applications page provides a list of applications detected in the mesh. Clicking an application opens a dedicated detail page with sub-tabs for Overview, Traffic, Inbound Metrics, and Traces. The application detail page displays an application badge and provides the same level of detail as the standalone Kiali Console.
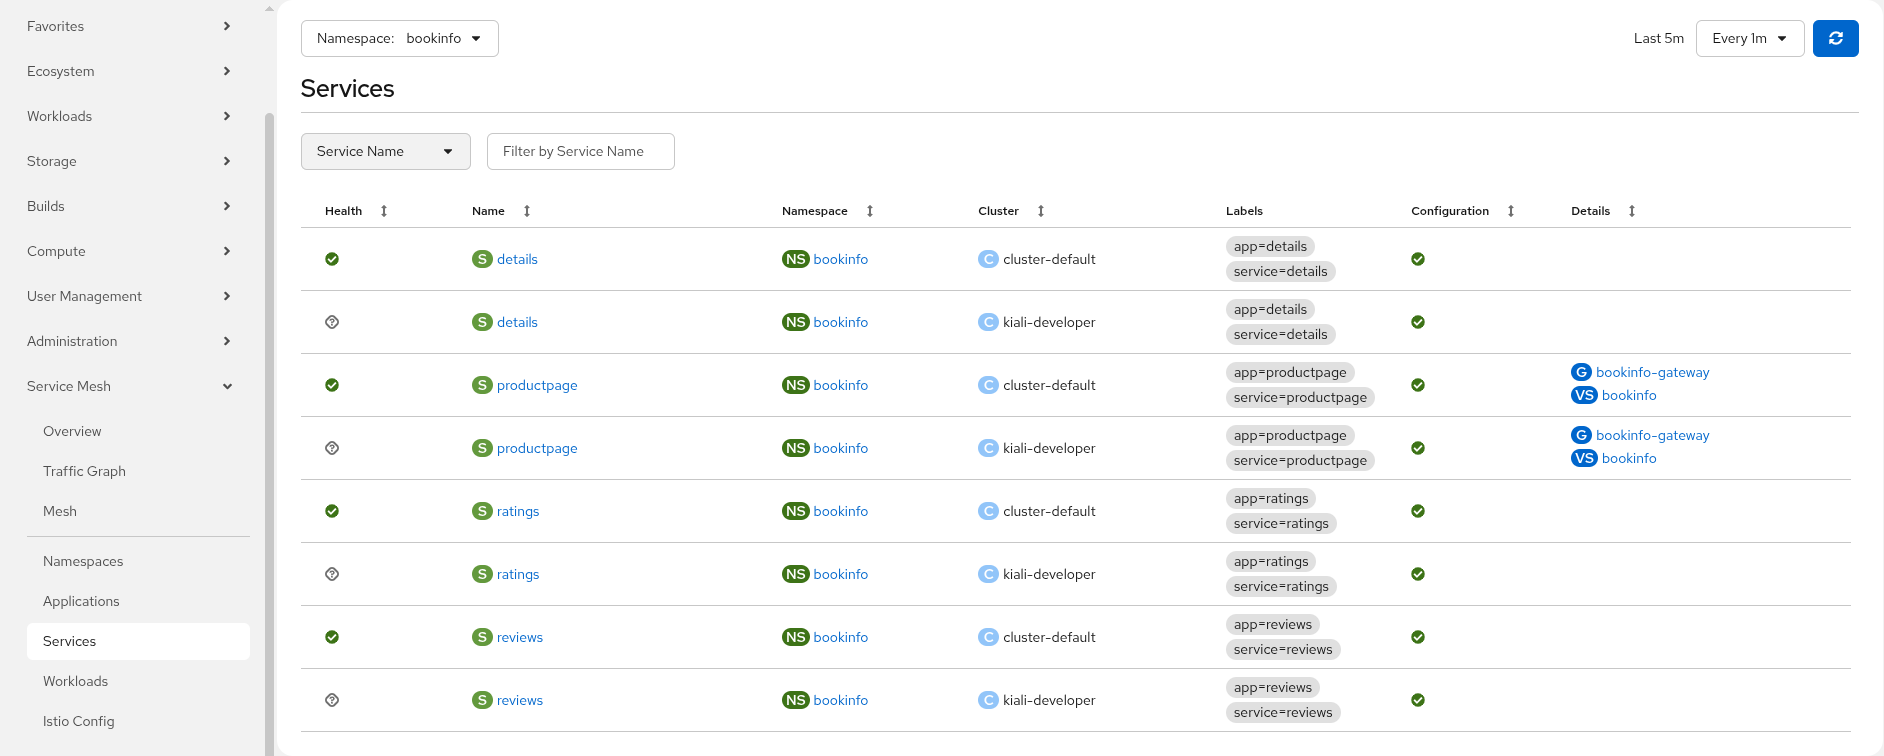
Services
The Services page provides a list of services in the mesh. Clicking a service opens a detail page with sub-tabs for Overview, Traffic, Inbound Metrics, and Traces.
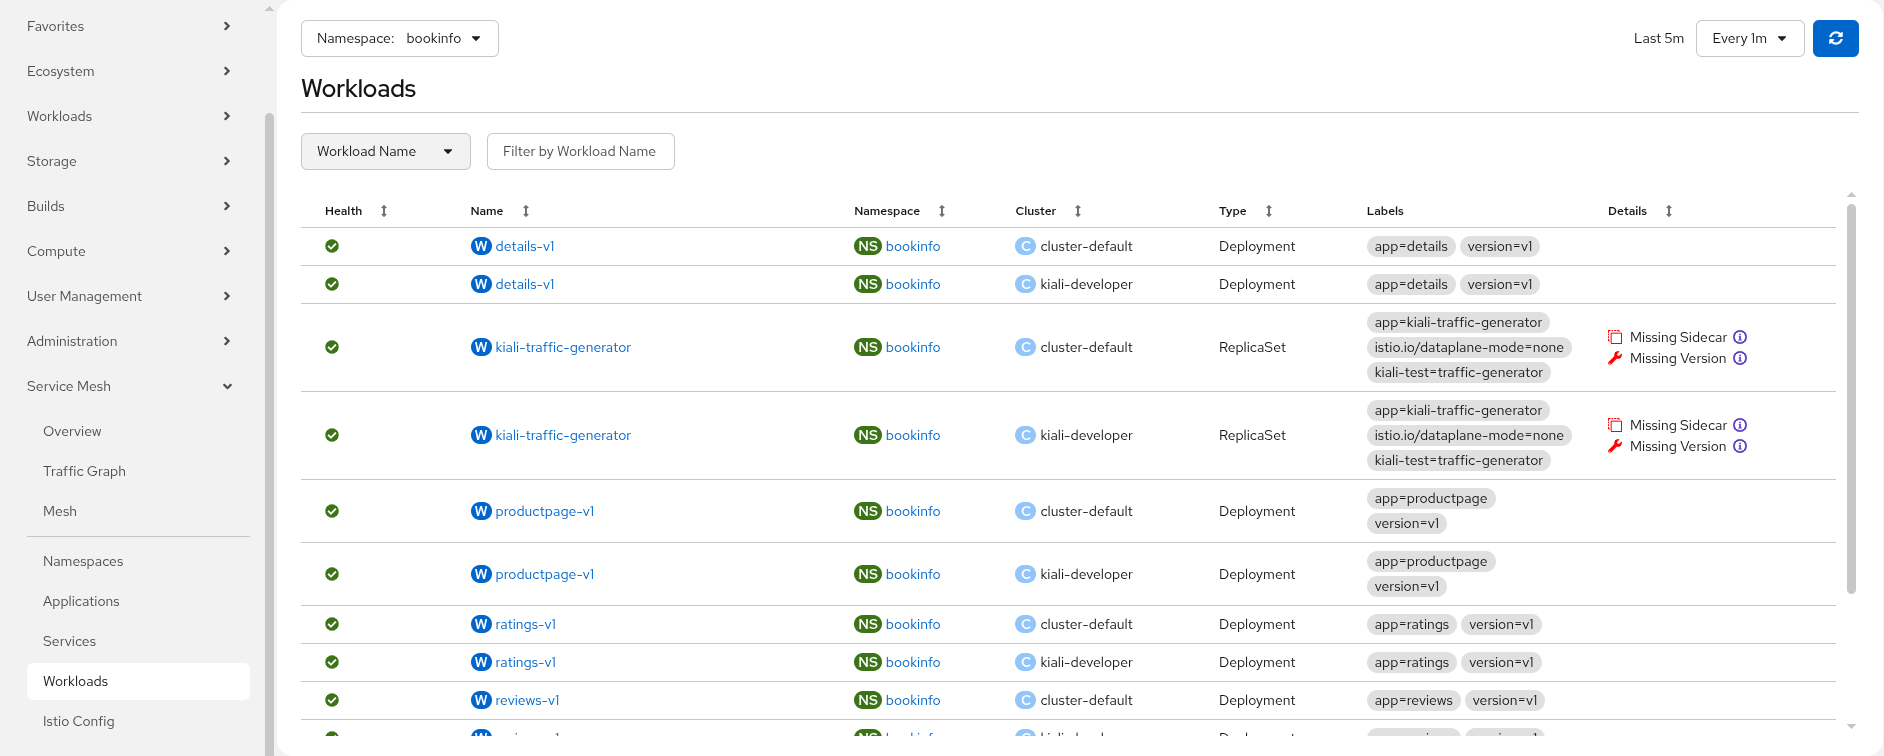
Workloads
The Workloads page provides a list of workloads in the mesh along with their health status, type, and associated Istio configuration. Clicking a workload navigates to the corresponding Kubernetes resource detail page (Deployment, ReplicaSet, DaemonSet, StatefulSet, etc.) with the Service Mesh tab selected.
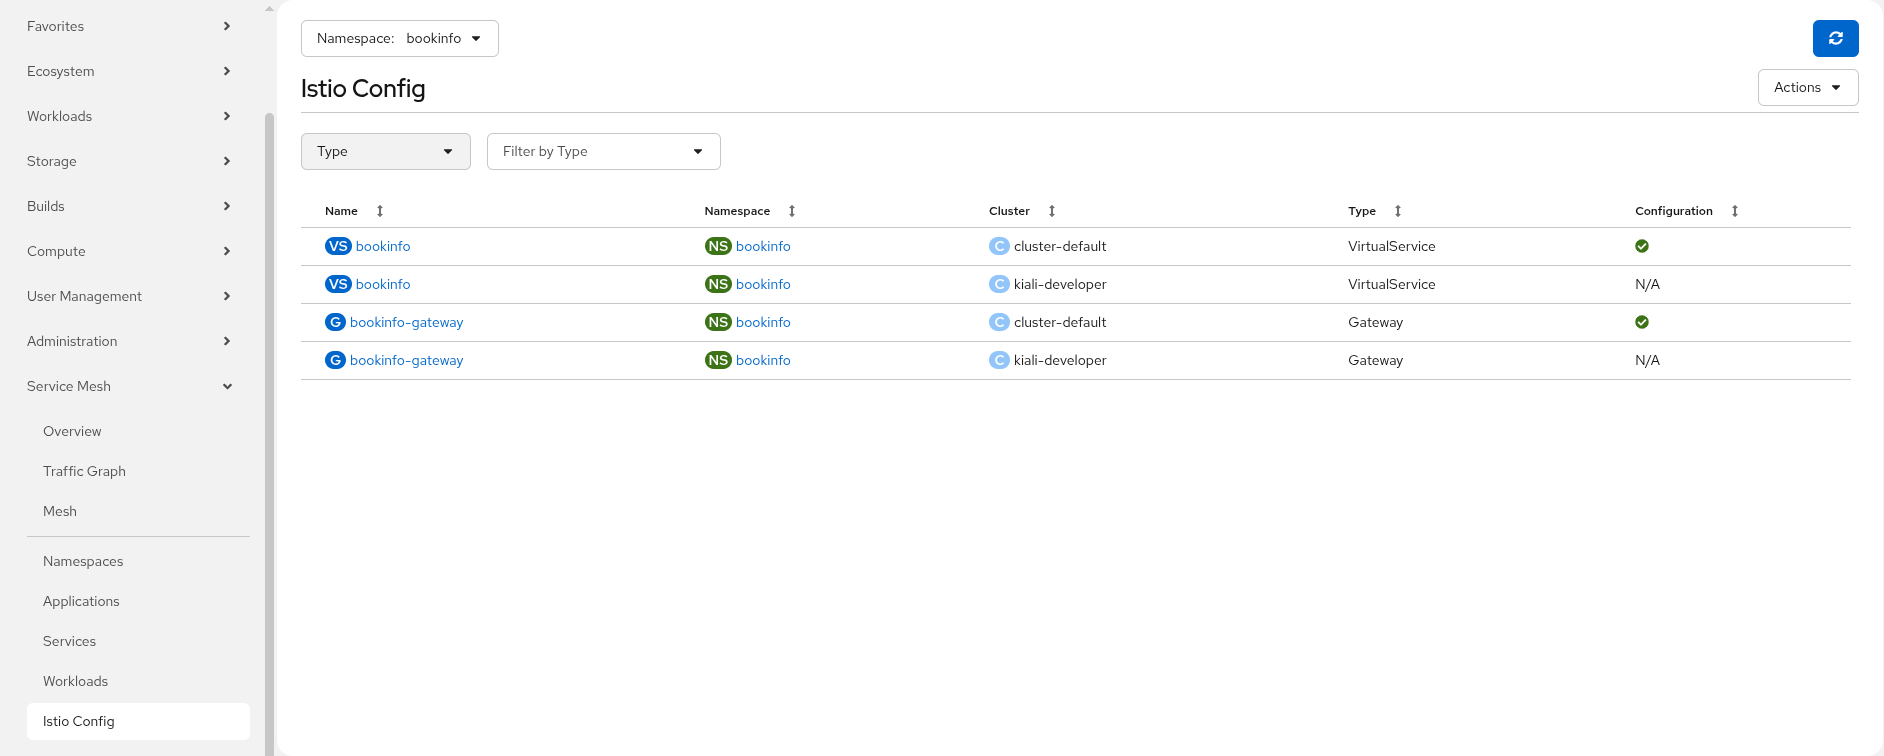
Istio Config
The Istio Config page provides a list of all Istio configuration files in your mesh with a column that provides a quick way to know if the configuration for each resource is valid. You can also create new Istio configuration resources from this page. The list page uses Kiali’s full filtering capabilities, including type, name, and validation status filters.
Workload Details
The Workloads detail view (accessible from the OpenShift Workloads pages such as Deployments, Pods, ReplicaSets, StatefulSets, and DaemonSets) has a tab Service Mesh that provides mesh-related detail for the selected workload. The details are grouped into several sub-tabs: Overview, Traffic, Logs, Inbound Metrics, Outbound Metrics, Traces, and Envoy.
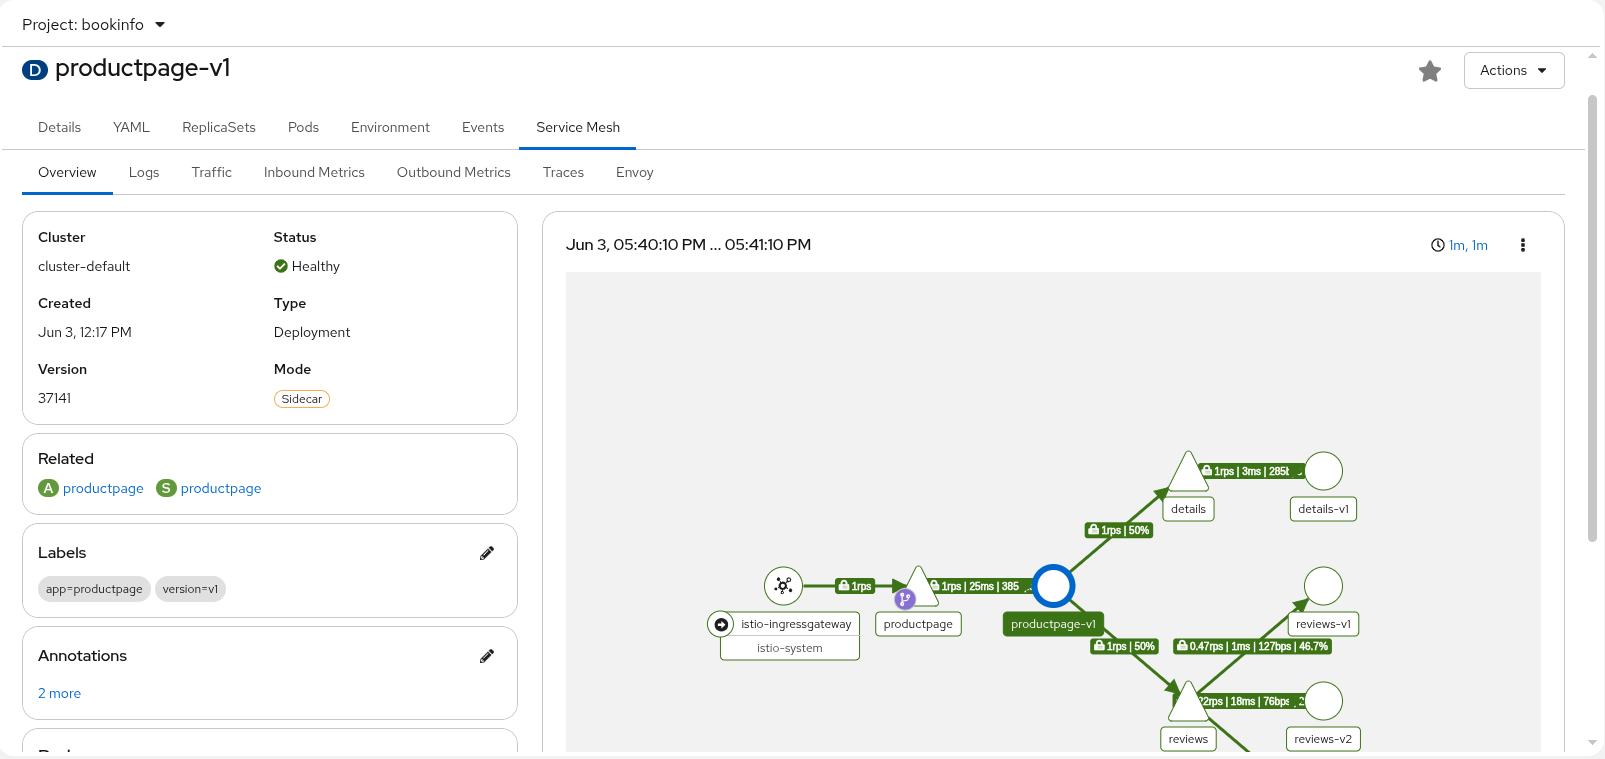
Workload: Overview
The Workload: Overview sub-tab provides a summary of the selected workload including a localized topology graph showing the workload with all inbound and outbound edges and nodes.
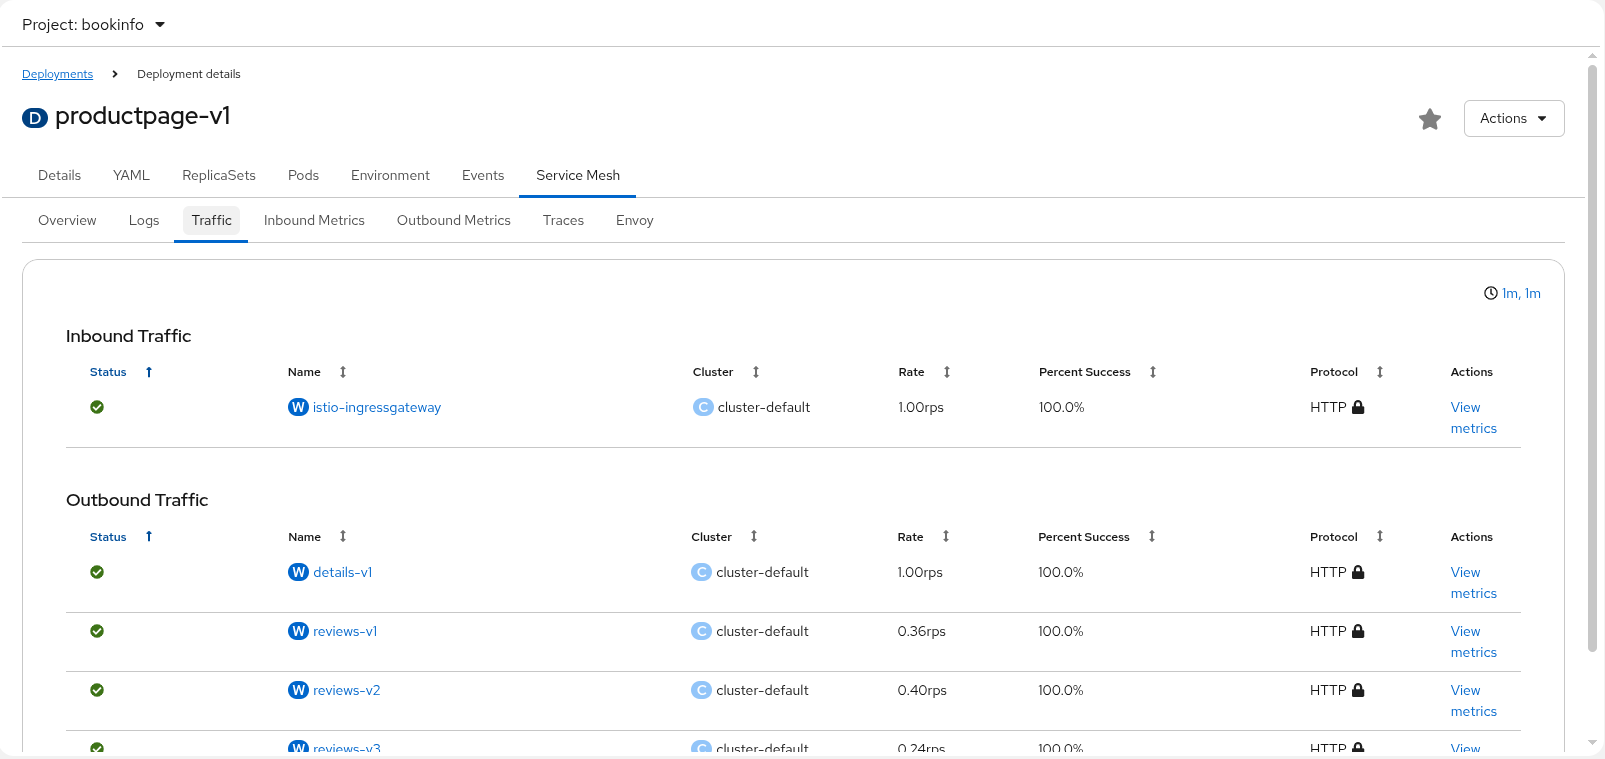
Workload: Traffic
The Workload: Traffic sub-tab provides information about all inbound and outbound traffic to the workload.
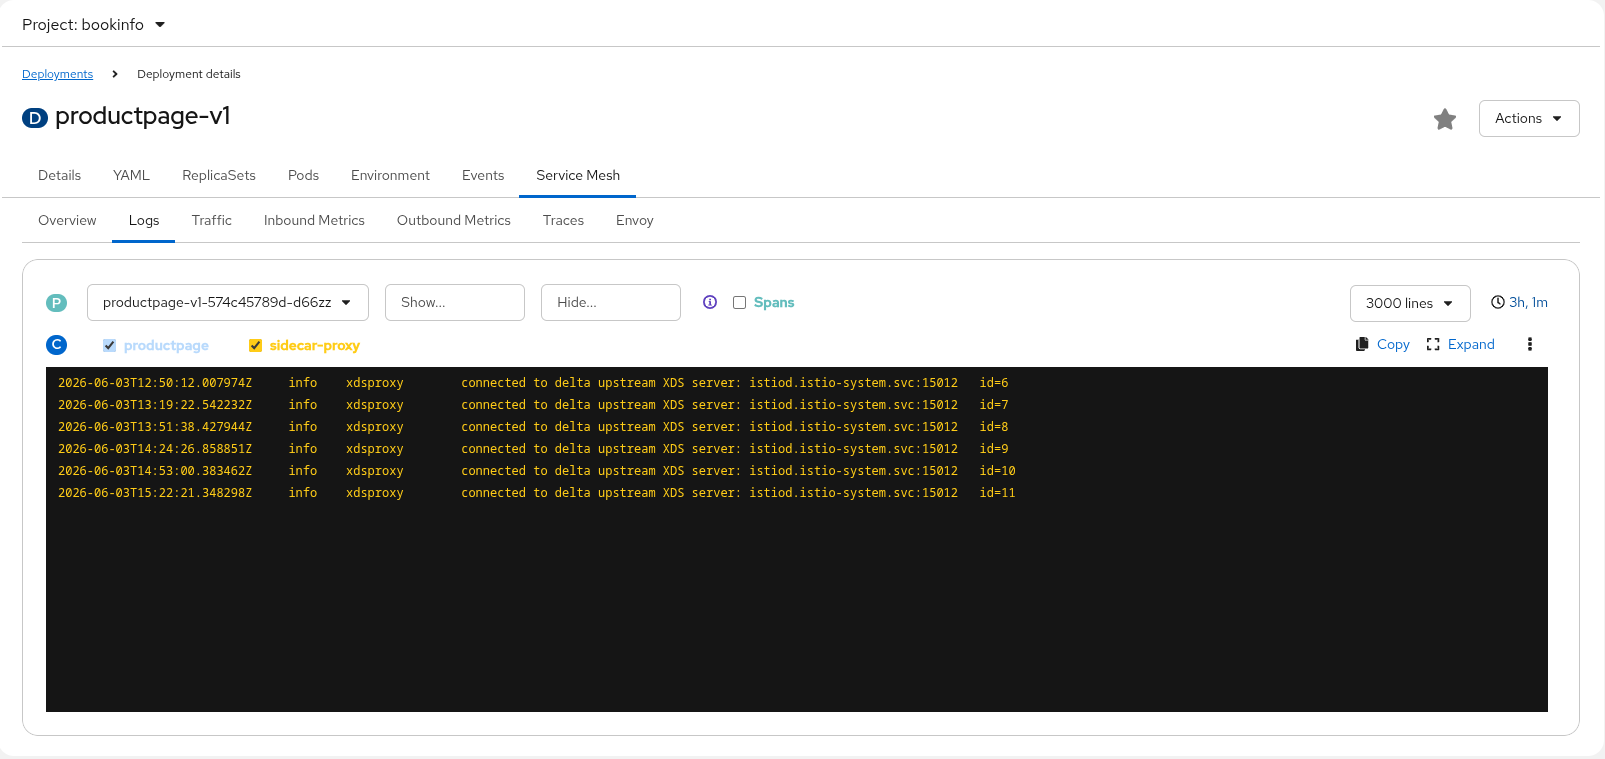
Workload: Logs
The Workload: Logs sub-tab provides the logs for the workload’s containers. You can view container logs individually or in a unified fashion, ordered by log time. This is especially helpful to see how the Envoy sidecar proxy logs relate to your workload’s application logs. You can enable the tracing span integration which then allows you to see which logs correspond to trace spans.
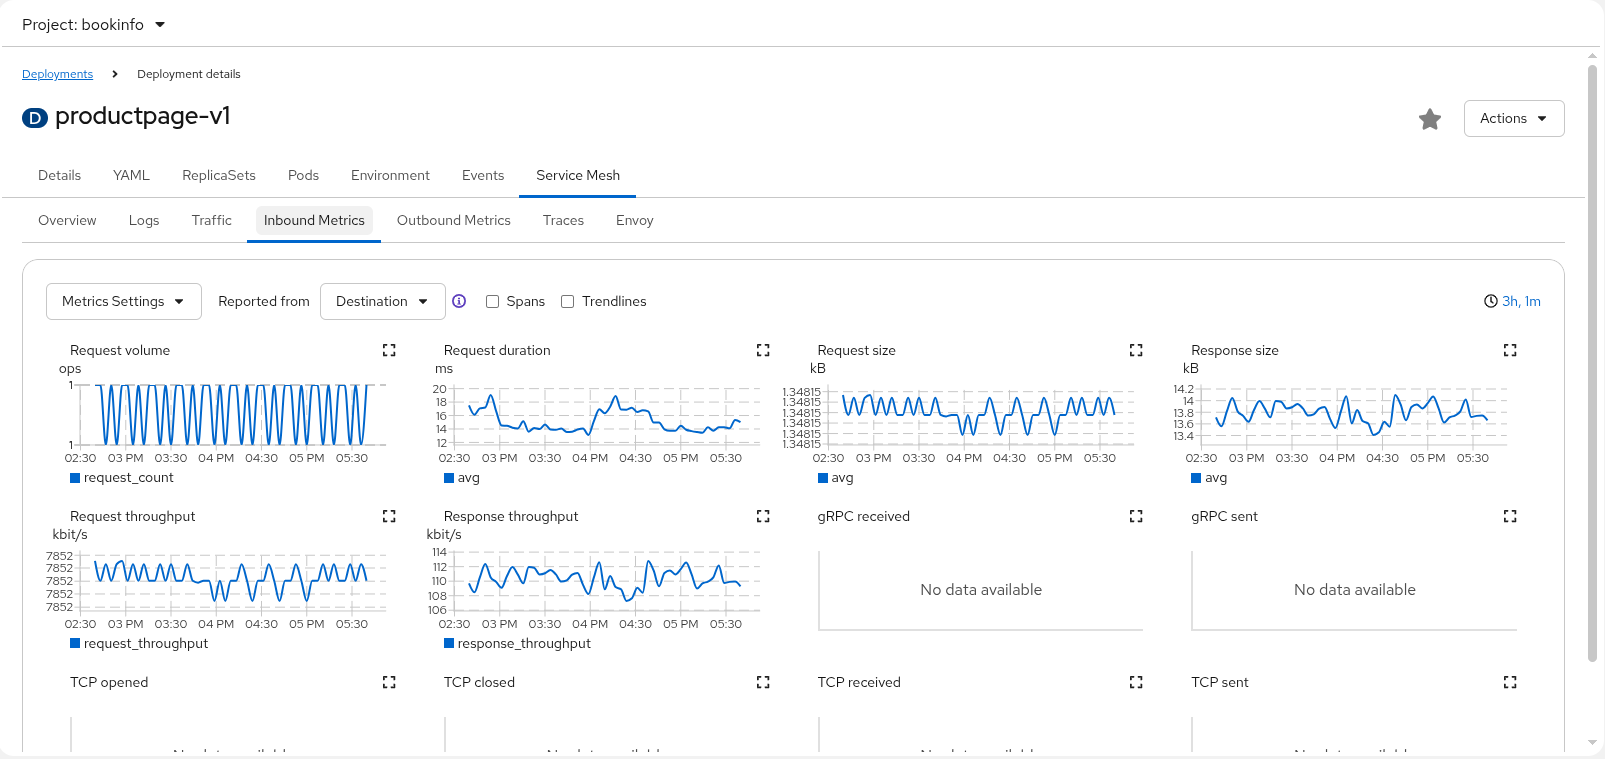
Workload: Metrics
You can see both inbound and outbound metric graphs in the corresponding sub-tabs. All the workload metrics can be displayed here, providing you with a detail view of the performance of your workload. You can enable the tracing span integration which allows you to see which spans occurred at the same time as the metrics. You can then click on a span marker in the graph to view the specific spans associated with that timeframe.
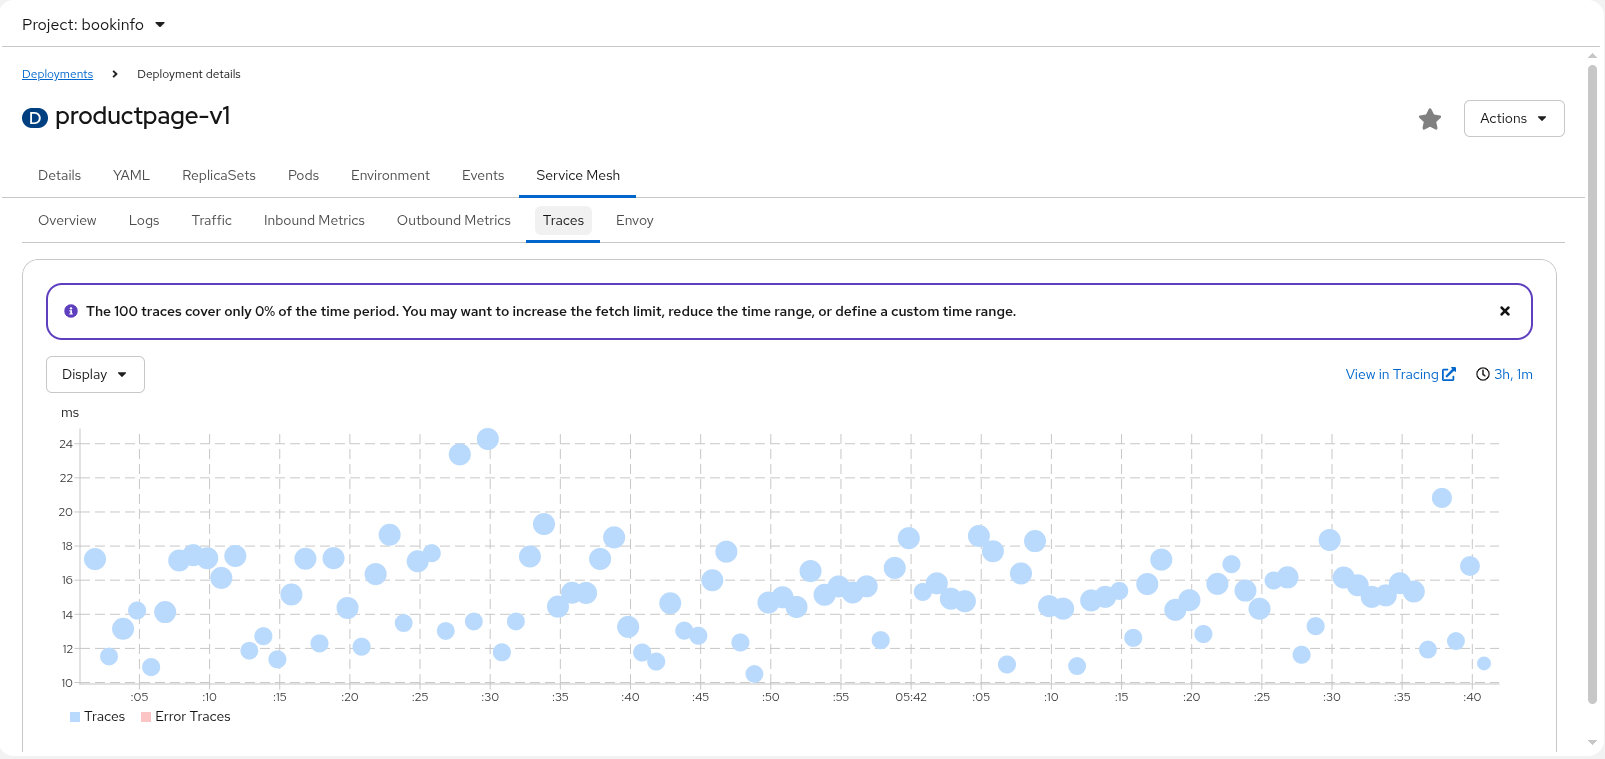
Workload: Traces
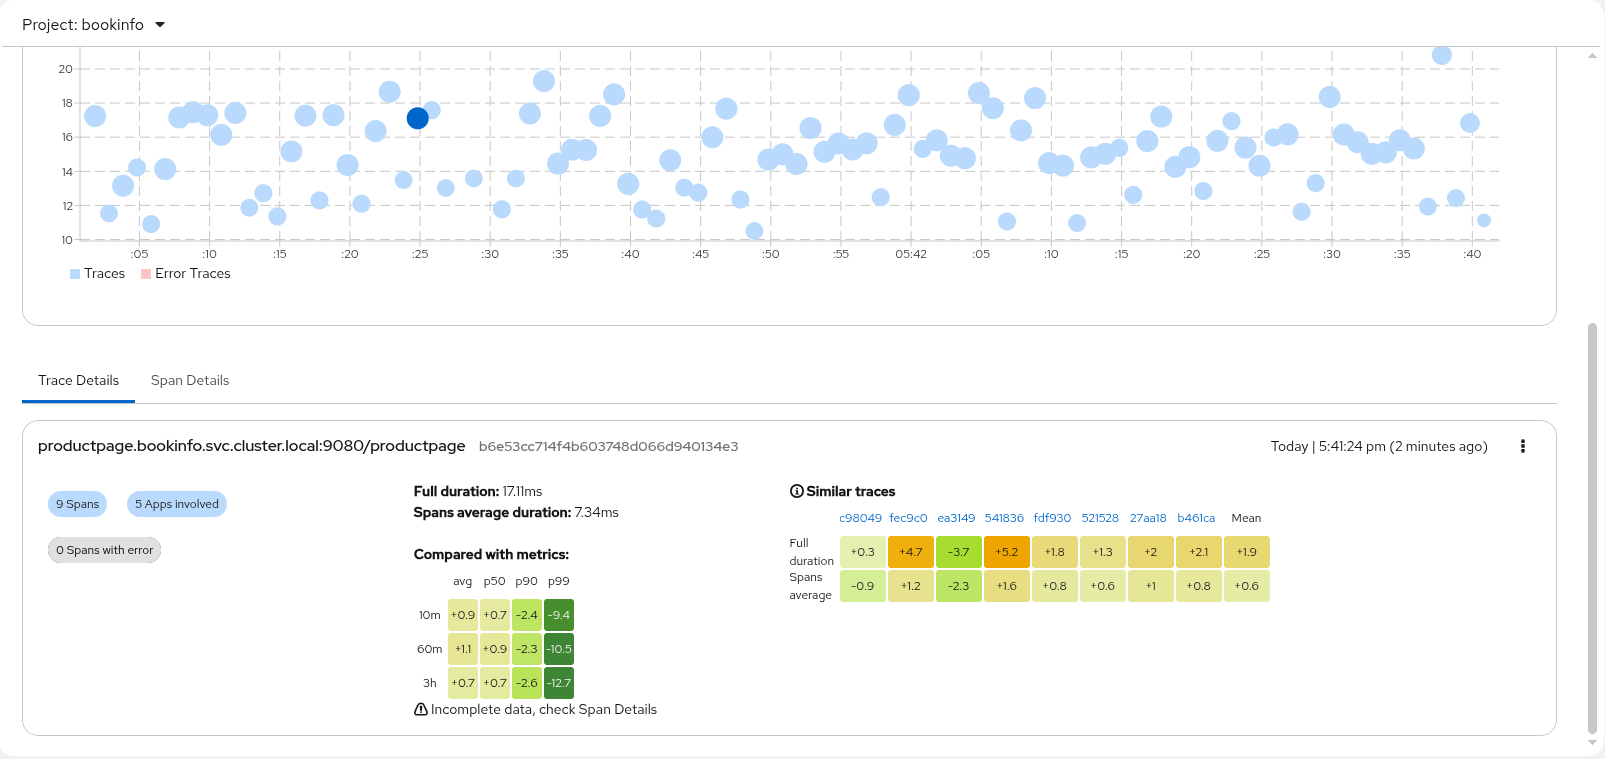
The Traces sub-tab provides a chart showing the trace spans collected over the given timeframe. Click on a bubble to drill down into those trace spans; the trace spans can provide you the most low-level detail within your workload application, down to the individual request level.
The trace details view will give further details, including heatmaps that provide you with a comparison of one span in relation to other requests and spans in the same timeframe.
When the OpenShift tracing UI plugin is enabled, Kiali will try to auto discover the plugin settings and the View in Tracing Kiali link will redirect to the plugin (for Kiali 2.8.0+).
If the plugin config needs to be adjusted, the following settings should be included in the plugin-conf ConfigMap:
{
  ...
  "observability": {
    "instance": "sample",
    "namespace": "tempo",
    "tenant": "default"
  }
}
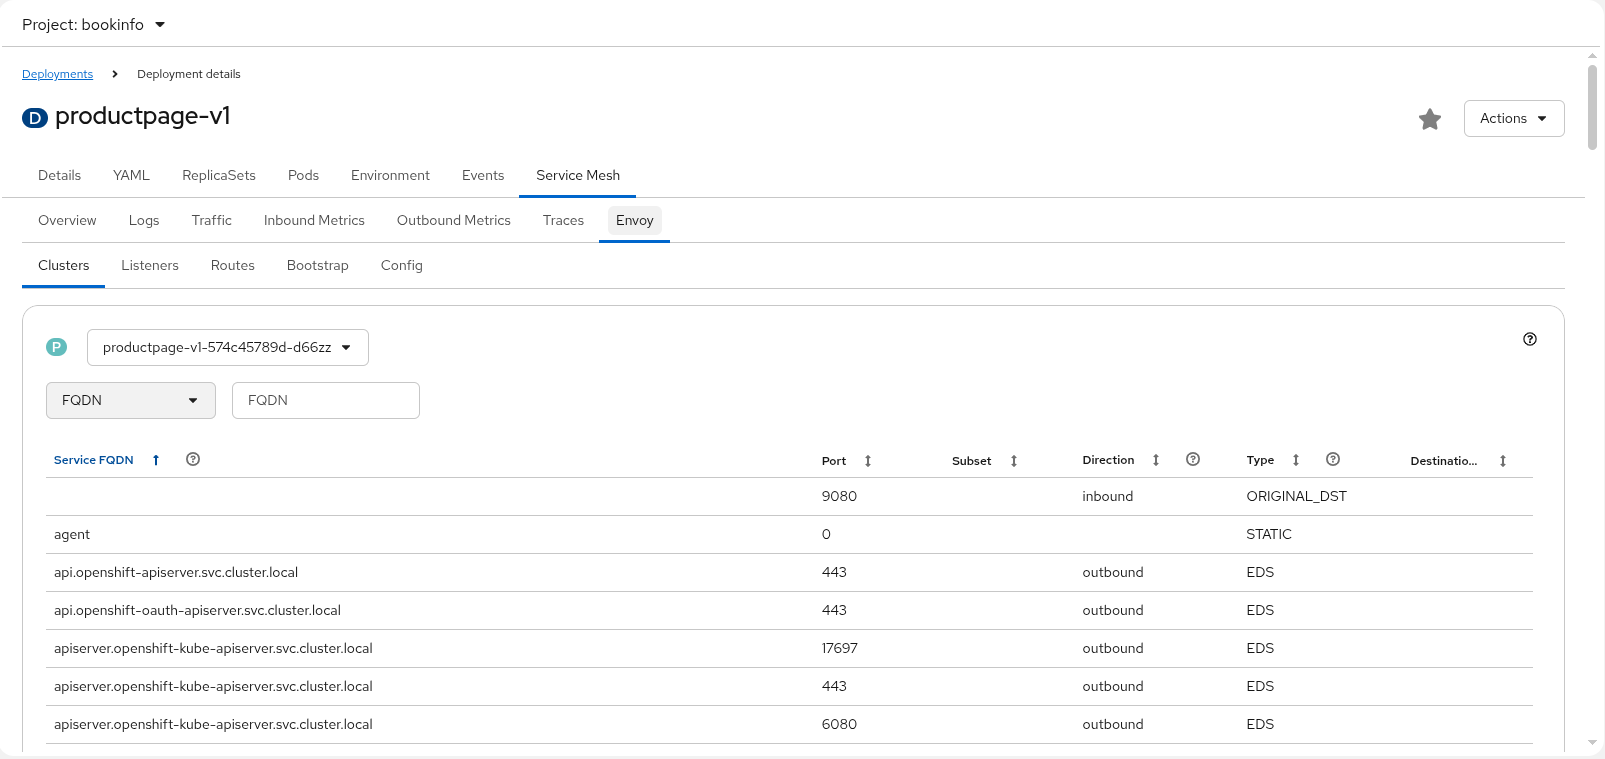
Workload: Envoy
The Envoy sub-tab provides information about the Envoy sidecar configuration. This is useful when you need to dig down deep into the sidecar configuration when debugging things such as connectivity issues.
Application Details
The Applications detail page provides mesh-related detail for the selected application, including a localized topology graph, traffic information, inbound metrics, and traces. The detail page is accessible both from the OSSMC Applications list page and from graph node navigation.
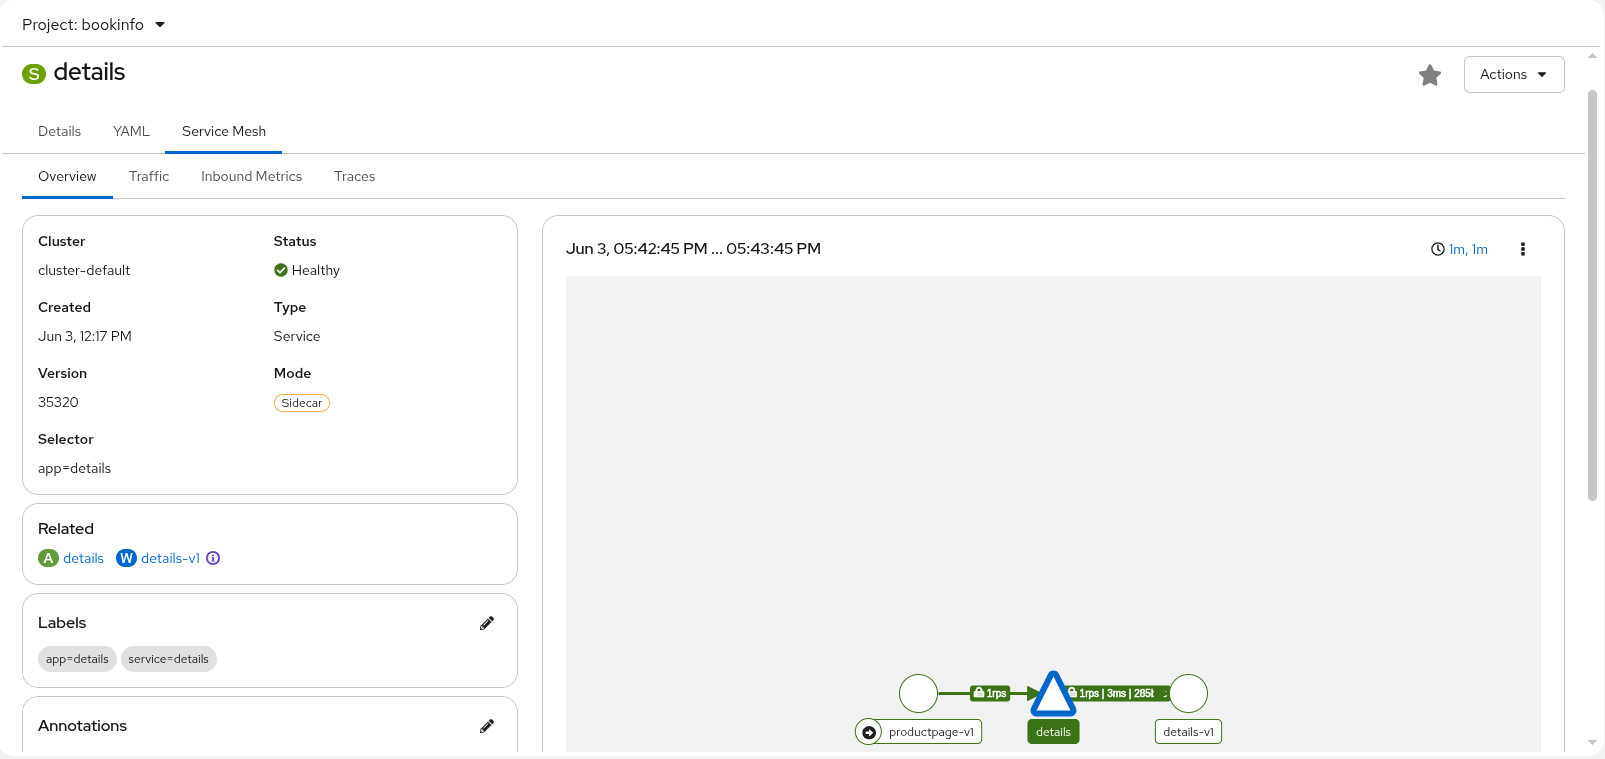
Service Details
The Services detail view has a tab Service Mesh that provides mesh-related detail for the selected service. The details are grouped into several sub-tabs: Overview, Traffic, Inbound Metrics, Traces. These sub-tabs are similar in nature as the Workload sub-tabs with the same names and serve the same functions.
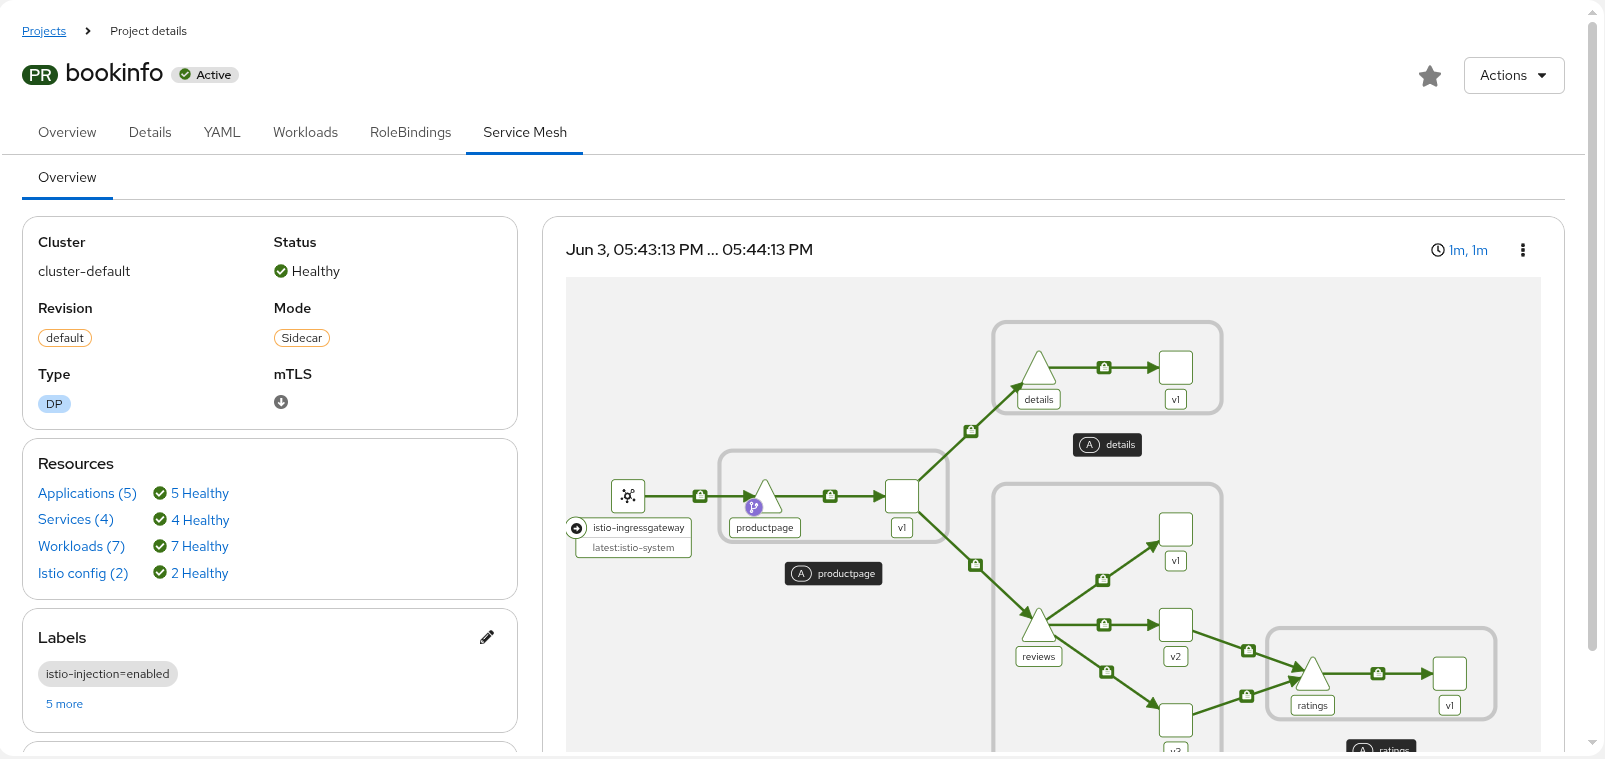
Project Details
The Projects detail view has a tab Service Mesh that provides mesh-related detail for that project with a split-panel layout showing project attributes, resource links, health information, and a namespace-scoped traffic minigraph.
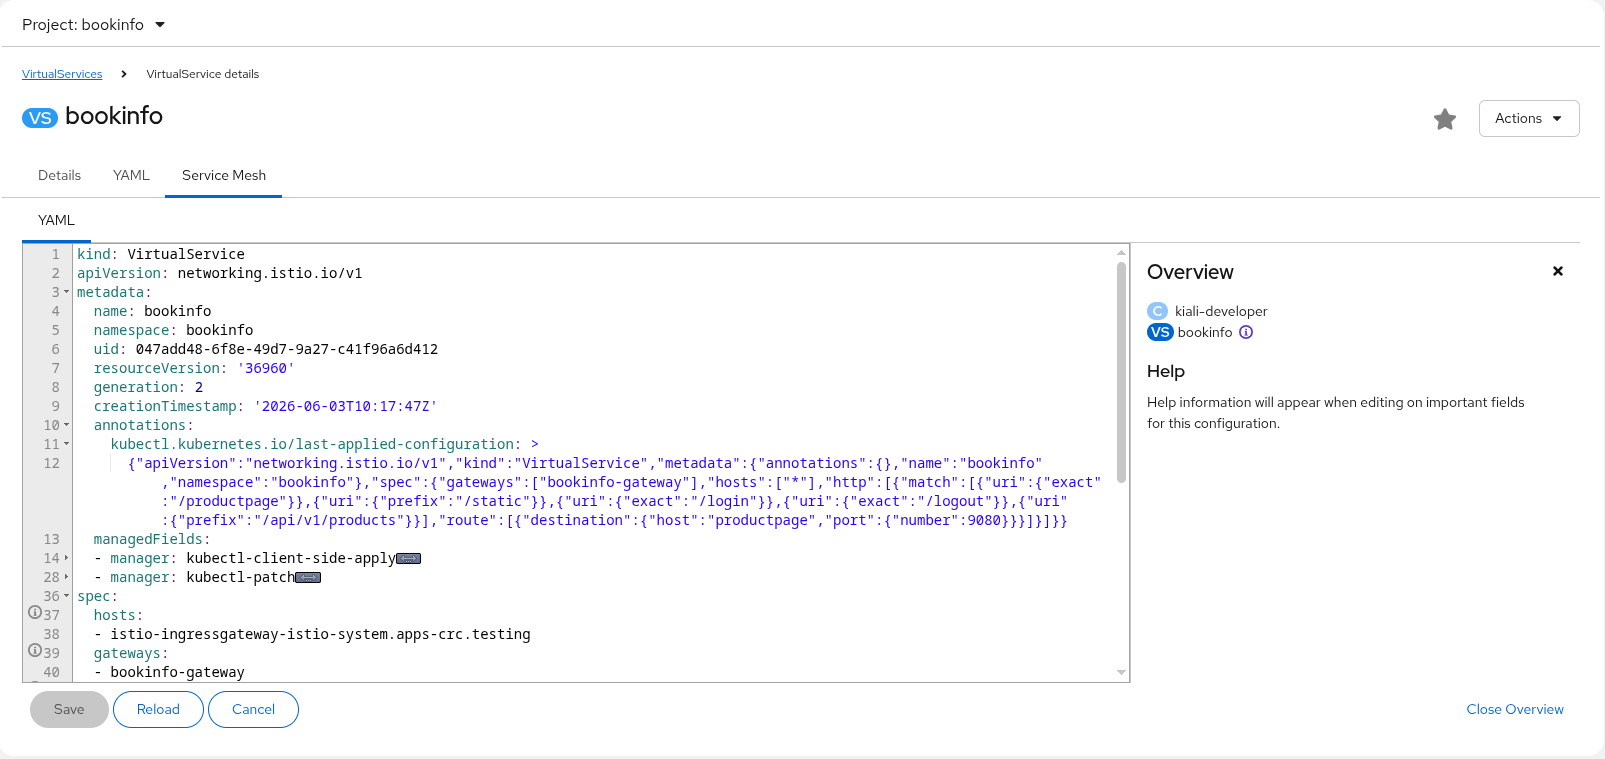
Istio Config Details
The detail pages for Istio configuration resources (such as VirtualService, DestinationRule, Gateway, AuthorizationPolicy, and others) have a Service Mesh tab that shows an overview and validation status for the resource.