General
How do I determine what version I am running?
There are several components within the Istio/Kiali infrastructure that have version information.
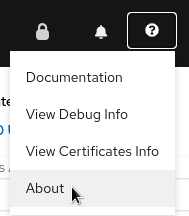
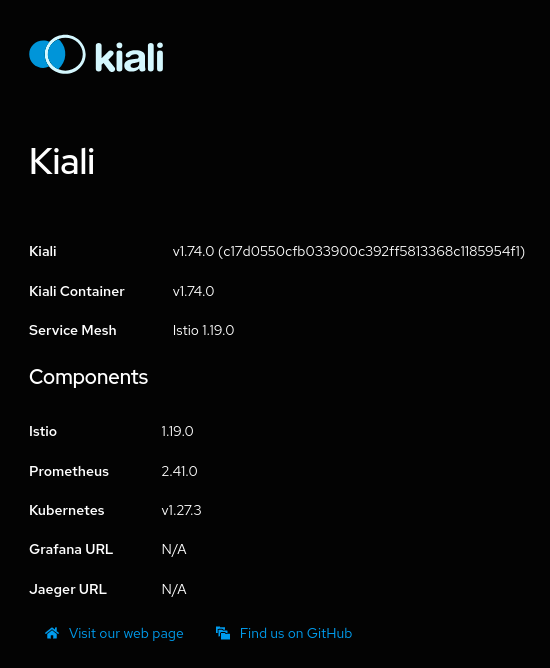
- To see the Kiali version for the instance running your UI: Go to the Help dropdown menu found at the top-right of the Kiali Console window and select “About”. This will pop up the About dialog box which displays detailed information for the current Kiali instance. From here you can also link to the Mesh page.
Help dropdown menu:
The Kiali About box:
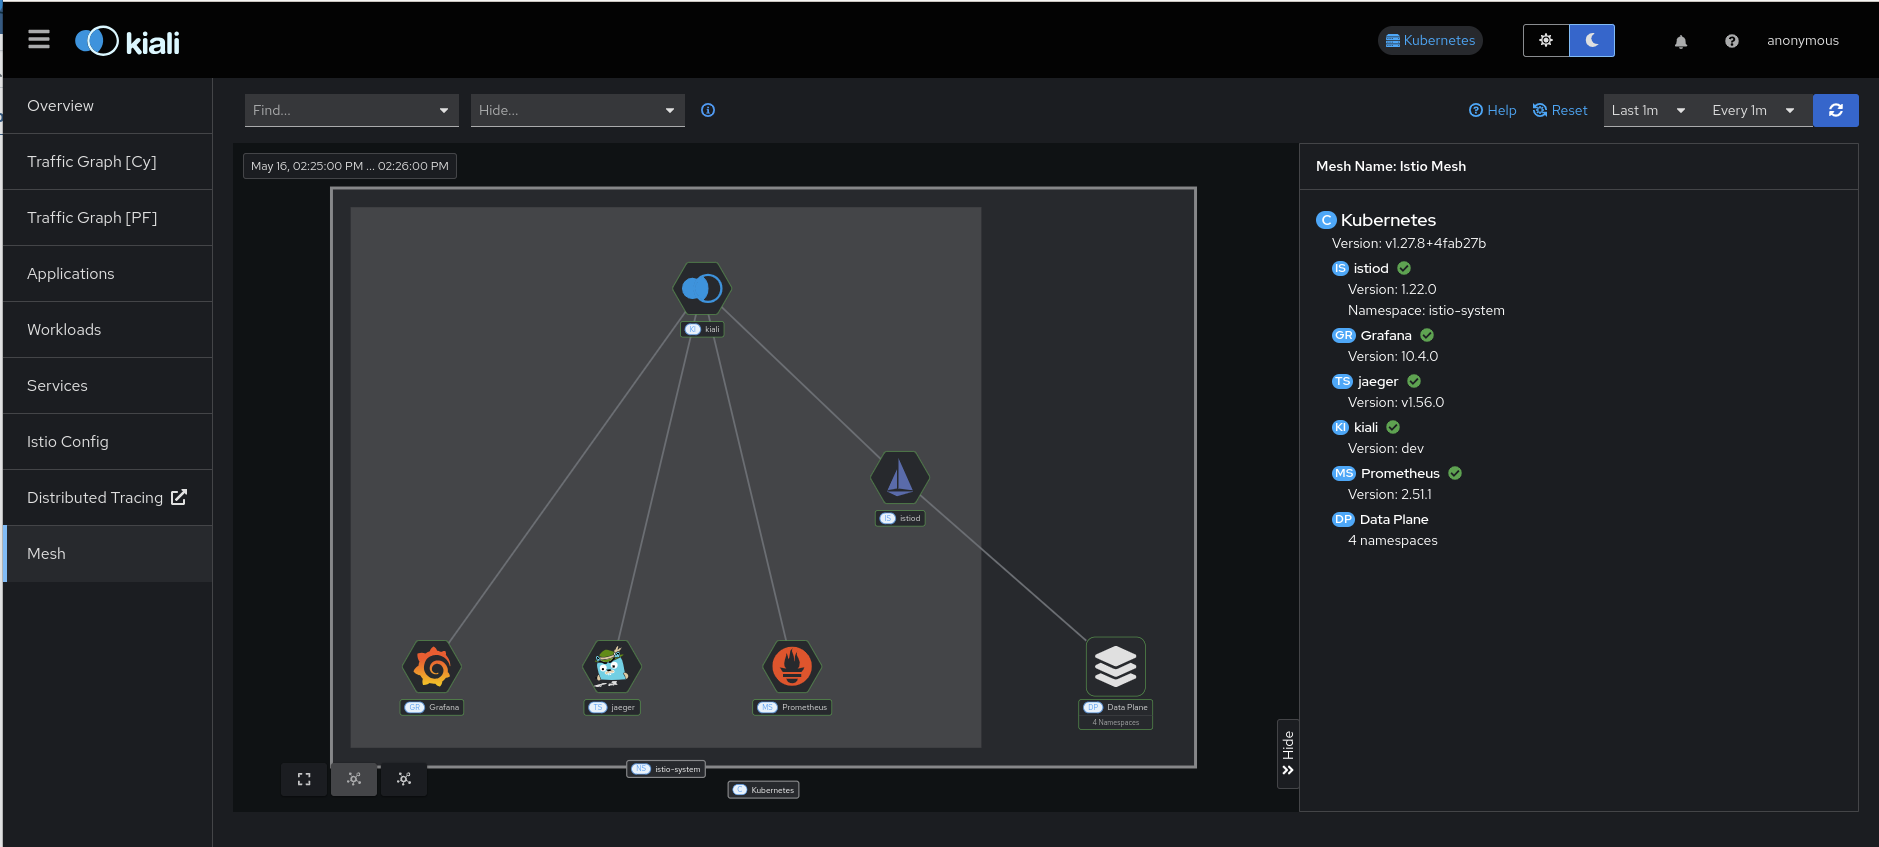
- To see version information for the infrastruction components in your mesh: Go to the main menu and select the “Mesh” page option. This will bring you to a graphical representation of your mesh. The default side-panel will present a summary of the infrastructure components and, if possible to determine, their versions. This will include things like Istio, Prometheus, etc. You can also select graph nodes to see any further details that may be available for that component.
- You can also get much of this same version information in JSON format. From the command line, run something like
curlto obtain the version information from the/apiendpoint. For example, expose Kiali via port-forwarding socurlcan access it:
kubectl port-forward -n istio-system deploy/kiali 20001:20001
And then request the version information via curl:
curl http://localhost:20001/kiali/api
The version information will be provided in a JSON format such as this:
{
  "status": {
    "Kiali commit hash": "c17d0550cfb033900c392ff5813368c1185954f1",
    "Kiali container version": "v1.74.0",
    "Kiali state": "running",
    "Kiali version": "v1.74.0",
    "Mesh name": "Istio",
    "Mesh version": "1.19.0"
  },
  "externalServices": [
    {
      "name": "Istio",
      "version": "1.19.0"
    },
    {
      "name": "Prometheus",
      "version": "2.41.0"
    },
    {
      "name": "Kubernetes",
      "version": "v1.27.3"
    },
    {
      "name": "Grafana"
    },
    {
      "name": "Jaeger"
    }
  ],
  "warningMessages": [],
  "istioEnvironment": {
    "isMaistra": false,
    "istioAPIEnabled": true
  }
}
- Obtain the container image being used by the Kiali Server pod:
kubectl get pods --all-namespaces -l app.kubernetes.io/name=kiali -o jsonpath='{.items..spec.containers[*].image}{"\n"}'
This will result in something like: quay.io/kiali/kiali:v1.74.0
- Obtain the container image being used by the Kiali Operator pod:
kubectl get pods --all-namespaces -l app.kubernetes.io/name=kiali-operator -o jsonpath='{.items..spec.containers[*].image}{"\n"}'
This will result in something like: quay.io/kiali/kiali-operator:v1.74.0
- Obtain the container image being used by the istiod pod:
kubectl get pods --all-namespaces -l app=istiod -o jsonpath='{.items..spec.containers[*].image}{"\n"}'
This will result in something like: gcr.io/istio-release/pilot:1.19.0
- If Kiali and/or Istio are installed via helm charts, obtain the helm chart version information:
helm list --all-namespaces
As an example, if you installed Kiali Operator via helm, this will result in something like:
NAME             NAMESPACE        REVISION   UPDATED                                   STATUS     CHART                   APP VERSION
kiali-operator   kiali-operator   1          2023-09-26 09:52:21.266593138 -0400 EDT   deployed   kiali-operator-1.74.0   v1.74.0
Why is the Workload or Application Detail page so slow or not responding?
We have identified a performance issue that happens while visiting the Workload or Application detail page, related to discovering metrics in order to show custom dashboards. Both Kiali and Prometheus may run out of memory.
The immediate workaround is to disable dashboards discovery:
spec:
  external_services:
    custom_dashboards:
      discovery_enabled: "false"
It’s also recommended to consider a more robust setup for Prometheus, like the one described in this Istio guide (see also this Kiali blog post), in order to decrease the metrics cardinality.
What do I need to run Kiali in a private cluster?
Private clusters have higher network restrictions. Kiali needs your cluster to allow TCP traffic between the Kubernetes API service and the Istio Control Plane namespace, for both the 8080 and 15000 ports. This is required for features such as Health and Envoy Dump to work as expected.
Make sure that the firewalls in your cluster allow the connections mentioned above.
Check section Google Kubernetes Engine (GKE) Private Cluster requirements in the Installation Guide.
Does Kiali support Internet Explorer?
No version of Internet Explorer is supported with Kiali. Users may experience some issues when using Kiali through this browser.
Kiali does not work - What do i do?
If you are hitting a problem, whether it is listed here or not, do not hesitate to open a GitHub Discussion to ask about your situation. If you are hitting a bug, or need a feature, you can vote (using emojis) for any existing bug or feature request found in the GitHub Issues. This will help us prioritize the most needed fixes or enhancements. You can also create a new issue.
See also the Community page which lists more contact channels.
How do I obtain the logs for Kiali?
Kiali operator logs can be obtained from within the Kiali operator pod. For example, if the operator is installed in the kiali-operator namespace:
KIALI_OPERATOR_NAMESPACE="kiali-operator"
kubectl logs -n ${KIALI_OPERATOR_NAMESPACE} $(kubectl get pod -l app=kiali-operator -n ${KIALI_OPERATOR_NAMESPACE} -o name)
Kiali server logs can be obtained from within the Kiali server pod. For example, if the Kiali server is installed in the istio-system namespace:
KIALI_SERVER_NAMESPACE="istio-system"
kubectl logs -n ${KIALI_SERVER_NAMESPACE} $(kubectl get pod -l app=kiali -n ${KIALI_SERVER_NAMESPACE} -o name)
Note that you can configure the logger in the Kiali Server.
Which Istio metrics and attributes are required by Kiali?
To reduce Prometheus storage some users want to customize the metrics generated by Istio. This can break Kiali if the pruned metrics and/or attributes are used by Kiali in its graph or metric features.
Kiali currently requires the following metrics and attributes:
| Metric | Notes |
|---|---|
| container_cpu_usage_seconds_total | used to graph cpu usage in the control plane overview card |
| container_memory_working_set_bytes | used to graph memory usage in the control plane overview card |
| process_cpu_seconds_total | used to graph cpu usage in the control plane overview card (if the container metric is not available); used in the Istiod application metrics dashboard |
| process_resident_memory_bytes | used to graph memory usage in the control plane overview card (if the container metric is not available) |
Istio metrics and attributes:
| Metric | Notes |
|---|---|
| istio_build | used to display ztunnel version information |
| istio_requests_total | used throughout Kiali and the primary metric for http/grpc request traffic |
| istio_request_bytes_bucket | used in metric displays to calculate throughput percentiles |
| istio_request_bytes_count | used in metric displays to calculate throughput avg |
| istio_request_bytes_sum | used throughout Kiali for throughput calculation |
| istio_request_duration_milliseconds_bucket | used throughout Kiali for response-time calculation |
| istio_request_duration_milliseconds_count | used throughout Kiali for response-time calculation |
| istio_request_duration_milliseconds_sum | used throughout Kiali for response-time calculation |
| istio_request_messages_total | used throughout Kiali for grpc sent message traffic |
| istio_response_bytes_bucket | used in metric displays to calculate throughput percentiles |
| istio_response_bytes_count | used in metric displays to calculate throughput avg |
| istio_response_bytes_sum | used throughout Kiali for throughput calculation |
| istio_response_messages_total | used throughout Kiali for grpc received message traffic |
| istio_tcp_connections_closed_total | used in metric displays |
| istio_tcp_connections_opened_total | used in metric displays |
| istio_tcp_received_bytes_total | used throughout Kiali for tcp received traffic |
| istio_tcp_sent_bytes_total | used throughout Kiali for tcp sent traffic |
| pilot_info | used as discovery metric for the Istiod dashboard |
| pilot_proxy_convergence_time_sum | used in control plane overview card to show the average proxy push time |
| pilot_proxy_convergence_time_count | used in control plane overview card to show the average proxy push time; used in the Istiod application metrics dashboard |
| pilot_services | used in the Istiod application metrics dashboard |
| pilot_xds | used in the Istiod application metrics dashboard |
| pilot_xds_pushes | used in the Istiod application metrics dashboard |
| workload_manager_active_proxy_count | used for ztunnel workload manager active proxy count |
| Attribute | Metric | Notes |
|---|---|---|
| app | istio_tcp_received_bytes_total | used for filtering ztunnel traffic in TCP queries; also included in TCP traffic groupBy clauses |
| istio_tcp_sent_bytes_total | used for filtering ztunnel traffic in TCP queries; also included in TCP traffic groupBy clauses | |
| connection_security_policy | istio_requests_total | used only when graph Security display option is enabled |
| istio_tcp_received_bytes_total | used only when graph Security display option is enabled | |
| istio_tcp_sent_bytes_total | used only when graph Security display option is enabled | |
| destination_canonical_revision | all | |
| destination_canonical_service | all | |
| destination_cluster | all | |
| destination_principal | istio_requests_total | used only when graph Security display option is enabled |
| istio_request_messages_total | ||
| istio_response_messages_total | ||
| istio_tcp_received_bytes_total | ||
| istio_tcp_sent_bytes_total | ||
| destination_service | all | |
| destination_service_name | all | |
| destination_service_namespace | all | |
| destination_workload | all | |
| destination_workload_namespace | all | |
| grpc_response_status | istio_requests_total | used only when request_protocol=“grpc” |
| istio_request_bytes_sum | ||
| istio_request_duration_milliseconds_bucket | ||
| istio_request_duration_milliseconds_sum | ||
| istio_response_bytes_sum | ||
| reporter | all | both “source” and “destination” metrics are used by Kiali |
| request_operation | istio_requests_total | used only when request classification is configured. “request_operation” is the default attribute, it is configurable. |
| istio_request_bytes_sum | ||
| istio_response_bytes_sum | ||
| request_protocol | istio_requests_total | |
| istio_request_bytes_sum | ||
| istio_response_bytes_sum | ||
| response_code | istio_requests_total | |
| istio_request_bytes_sum | ||
| istio_request_duration_milliseconds_bucket | ||
| istio_request_duration_milliseconds_sum | ||
| istio_response_bytes_sum | ||
| response_flags | istio_requests_total | |
| istio_request_bytes_sum | ||
| istio_request_duration_milliseconds_bucket | ||
| istio_request_duration_milliseconds_sum | ||
| istio_response_bytes_sum | ||
| source_canonical_revision | all | |
| source_canonical_service | all | |
| source_cluster | all | |
| source_principal | istio_requests_total | |
| istio_request_messages_total | ||
| istio_response_messages_total | ||
| istio_tcp_received_bytes_total | ||
| istio_tcp_sent_bytes_total | ||
| source_workload | all | |
| source_workload_namespace | all |
Envoy metrics:
| Metric | Notes |
|---|---|
| envoy_cluster_upstream_cx_active | used in workload details |
| envoy_cluster_upstream_rq_total | used in workload details |
| envoy_listener_downstream_cx_active | used in workload details |
| envoy_listener_http_downstream_rq | used in workload details |
| envoy_server_memory_allocated | used in workload details |
| envoy_server_memory_heap_size | used in workload details |
| envoy_server_uptime | used in workload details |
What is the License?
See here for the Kiali license.
Why isn’t my namespace in the Namespace Selection dropdown?
Kiali can be told to restrict the namespaces users can see via the Kiali CR spec.deployment.discovery_selectors field. If there are no discovery selectors defined, Kiali will allow all namespaces unless deployment.cluster_wide_access is false, in which case only Kiali’s own namespace and the Istio control plane namespace will be accessible. If a namespace does not match one of the discovery selectors defined in the Kiali CR spec.deployment.discovery_selectors field at the time Kiali is installed by the operator it will not be visible in the Namespace Selection dropdown; if a new namespace is created after Kiali is installed and that namespace matches one of the discovery selectors, it will only be visible in the Namespace Selection dropdown after the operator creates the necessary Roles for the Kiali Server and restarts the Kiali Server pod (see Operator Namespace Watching). See the Namespace Management documentation for more information.
Note that Istio has its own set of optional discovery selectors that can be configured in the Istio MeshConfig discoverySelectors field, but these Istio discovery selectors are ignored by Kiali.
Kiali also caches namespaces by default for 10 seconds. Therefore, it might take up to the number of seconds specified by spec.kubernetes_config.cache_token_namespace_duration in order for a newly added namespace to be seen by Kiali.
Finally, per-user RBAC rules can also cause a namespace to be absent from the dropdown. If kiali_feature_flags.authz.require_namespace_get is enabled, a namespace that is accessible to the Kiali Server will still be hidden from a user who lacks GET permission on that namespace. See Namespace access control for more details.
Workload “is not found as” messages
Kiali queries Deployment ,ReplicaSet, ReplicationController, DeploymentConfig, StatefulSet, Job and CronJob controllers. Deployment, ReplicaSet and StatefulSet are always queried, but ReplicationController, DeploymentConfig, Job and CronJobs are excluded by default for performance reasons.
To include them, update the list of excluded_workloads from the Kiali config.
#    ---
#    excluded_workloads:
#    - "CronJob"
#    - "DeploymentConfig"
#    - "Job"
#    - "ReplicationController"
#
An empty list will tell Kiali to query all type of known controllers.
Why Health is not available for services using TCP protocol?
Health for Services is calculated based on success rate of traffic. The traffic of HTTP and GRPC protocols is request based and it is possible to inspect each request to check and extract response codes to determine how many requests succeeded and how many erred.
However, HTTP is a widely known protocol. Applications may use other less known protocols to communicate. For these cases, Istio logs the traffic as raw TCP (an opaque sequence of bytes) and is not analyzed. Thus, for Kiali it is not possible to know if any traffic have failed or succeeded and reports Health as unavailable.
Why are the control plane metrics missing from the control plane card?
The control plane metrics are fetched from the Prometheus configured in Kiali.
Kiali will fetch the memory and the CPU metrics related to the Istiod container (discovery) first and will fallback to the metrics related to the istiod process if it couldn’t find the container metrics. If the required metrics are not found then Kiali can not display the related charts or data.
The metrics used are:
| Metric | Notes |
|---|---|
| container_cpu_usage_seconds_total | used for Istiod’s discovery container CPU metric |
| container_memory_working_set_bytes | used for Istiod’s discovery container memory metric |
| process_cpu_seconds_total | used for Istiod process CPU metric |
| process_resident_memory_bytes | used for Istiod process memory metric |