MultiCluster on OpenShift
Install ACM, import a spoke cluster, deploy OSSM 3 with ambient and sidecar demo apps, and configure Kiali to query aggregated metrics from ACM’s central Thanos.
These tutorials walk through setting up Istio multi-cluster meshes on OpenShift using Red Hat Advanced Cluster Management (ACM) 2.17+, the Cluster Observability Operator (COO), and Kiali. ACM provides fleet management, and its multicluster observability add-on (MCOA) federates Istio and container metrics from each spoke cluster to hub Thanos via ScrapeConfig and PrometheusRule objects (requires COO on hub and spokes). COO also provides Perses metrics dashboards and the distributed tracing console plugin for Tempo, both integrated into the OpenShift console.
The finished environment has three OpenShift clusters: an ACM hub (ossm-kiali-hub) for fleet management and central Thanos metrics, and two Istio primary spokes (ossm-kiali-spoke and ossm-kiali-spoke-two) that share one multi-primary mesh. Kiali runs on the first spoke and reaches the second via a multi-cluster secret; Perses and Tempo add multi-cluster dashboards and tracing; health-status alerts can fire on each cluster or on the hub, and optionally appear on NetObserv Network Health. Click the diagram to open a full-size SVG in a new tab.
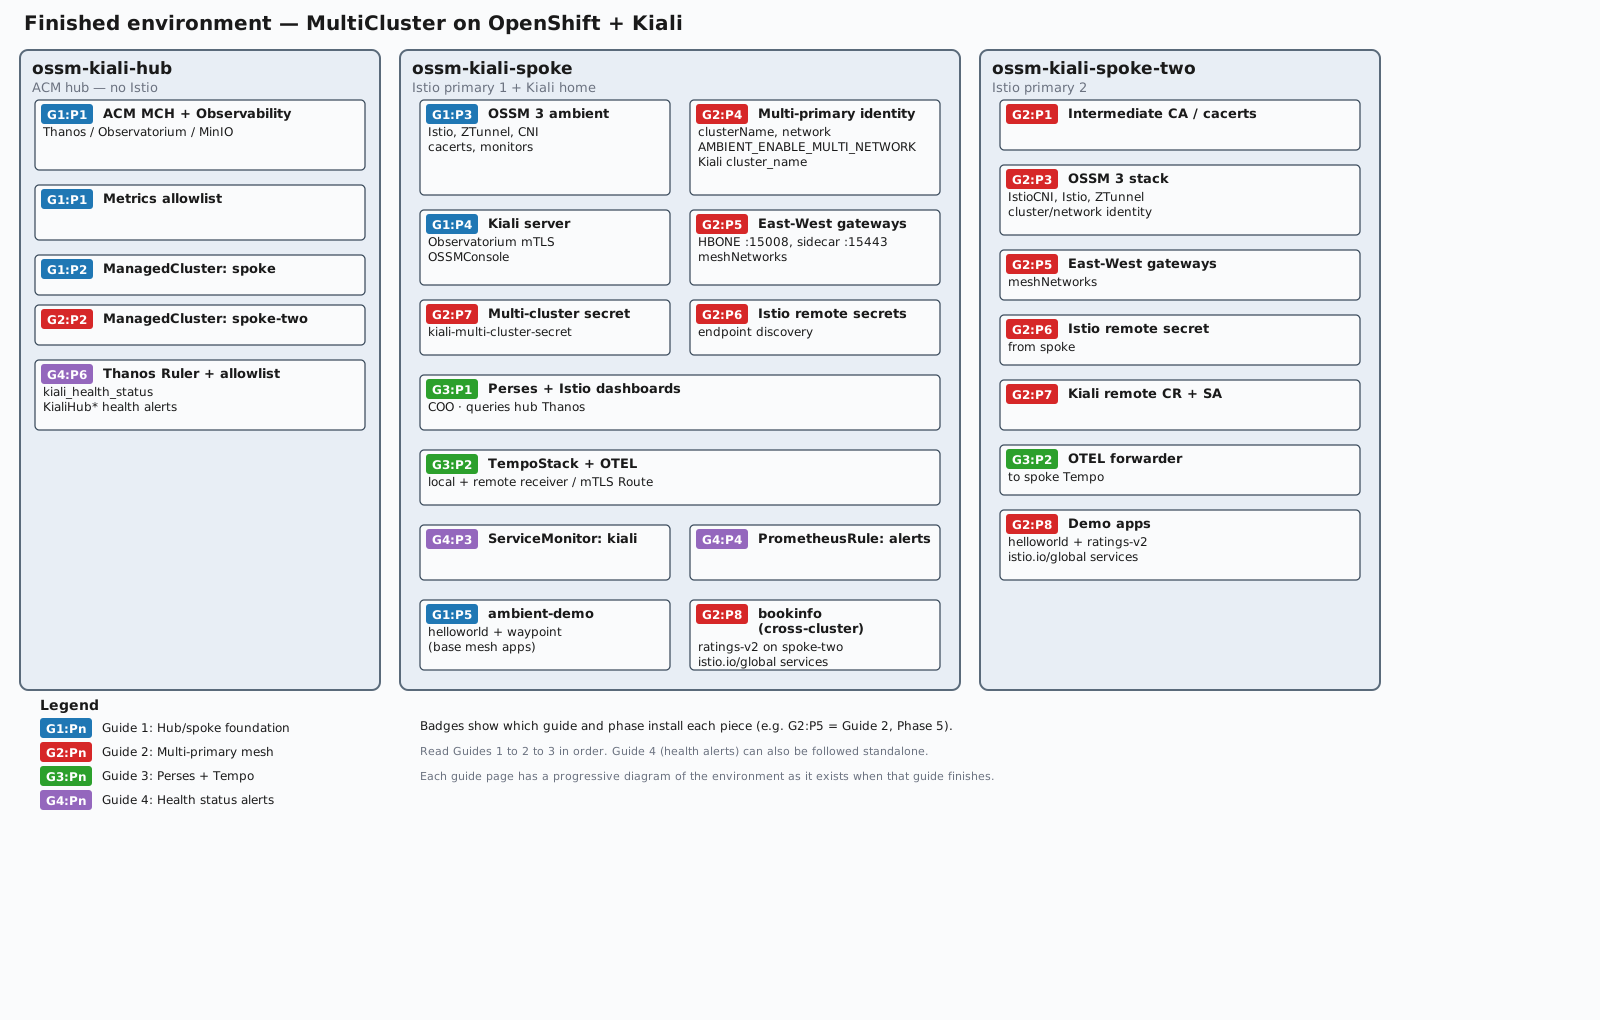
Badges such as G2:P5 mean Guide 2, Phase 5. Read Guides 1 → 2 → 3 in order; each guide page includes a progressive diagram of the environment as it exists when that guide finishes. Guide 4 (health status alerts and optional NetObserv Network Health) can also be followed standalone on any OpenShift cluster with Kiali.
Start with the hub/spoke guide; the multi-primary and dashboards/tracing guides build on it in sequence. Finish up with the health status alerts guide.
A script that automates all four guides is available for download:
Usage: ./ossm-multicluster-tutorial.sh [--hub-context <ctx>] [--spoke-context <ctx>] [--spoke-two-context <ctx>] [--guides 1,2,3,4] <install|uninstall>
If you only have two clusters (a hub and a single spoke), you can use --guides 1 to run Guide 1 as a standalone tutorial. The script requires a third cluster to install Guides 2–4.
Install ACM, import a spoke cluster, deploy OSSM 3 with ambient and sidecar demo apps, and configure Kiali to query aggregated metrics from ACM’s central Thanos.
Extend the single-cluster mesh from the hub/spoke guide into a true multi-primary Istio mesh by adding a second spoke cluster, with cross-cluster endpoint discovery and East-West gateways.
Add Perses metrics dashboards and Tempo distributed tracing to the multi-primary mesh, both backed by aggregated multi-cluster data.
Export Kiali health status as Prometheus metrics, scrape them with User Workload Monitoring, and define recording rules and alerts for OpenShift Observability and NetObserv Network Health.