Health Status Alerts
Overview
This guide shows how to export Kiali’s mesh health (Healthy / Not Ready / Degraded / Failure) as the Prometheus gauge kiali_health_status, scrape it with OpenShift User Workload Monitoring (UWM), and define useful recording rules and alerts that appear in the OpenShift console under Observe > Alerting. Optionally, Phase 7 installs NetObserv so those same rules also appear under Observe > Network Health.
Kiali computes traffic health and workload readiness for apps, services, workloads, and namespaces (see Traffic Health). When health-status metrics are enabled, each entity’s status is exported as the Prometheus gauge kiali_health_status — Kiali does not deploy Prometheus or act as Alertmanager; it only exports the gauge for your existing OpenShift monitoring stack to scrape and evaluate. The gauge values are:
0: Healthy1: Not Ready2: Degraded3: Failure
Those series can drive OpenShift Observability alerts on each cluster, and after federation via MCOA (Phase 6) they are available on ACM’s central Thanos for fleet-wide queries and hub alerts.
With ACM, you can alert on the managed cluster, on the hub, or both:
- Managed cluster — alerts fire under that cluster’s Observe > Alerting.
- Pros: low latency (UWM scrape + local
for); per-cluster ownership and routing - Cons: you must install and maintain a
PrometheusRuleon every cluster that runs Kiali
- Pros: low latency (UWM scrape + local
- Hub — alerts fire in ACM Observability (Grafana / Alertmanager on the hub).
- Pros: one place for fleet-wide rules; see health across managed clusters
- Cons: extra delay from ACM metric collection (often about five minutes) before the hub can evaluate
Which phases of this guide you need depends on your environment:
- Single-cluster OpenShift — Phases 1–5 cover everything: enable the metric, scrape it, create alerts, and optionally run the hands-on demo. Add Phase 7 if you want NetObserv Network Health on the same cluster.
- Multi-cluster with ACM Observability — start with Phases 1–3 on each cluster that runs Kiali (enable the metric and scrape it). Then complete Phase 6 on the hub to federate
kiali_health_statusto hub Thanos via MCOA and add fleet-wide hub alerts. If you also want per-cluster alerts under each cluster’s Observe > Alerting, complete Phases 4–5 on the managed clusters. Phase 7 installs NetObserv on each Kiali cluster where you want Network Health.
In either case, you can optionally route fired alerts to third-party systems such as Slack, email, or generic webhooks — see Routing alerts to Slack, email, or webhooks at the end of this guide.
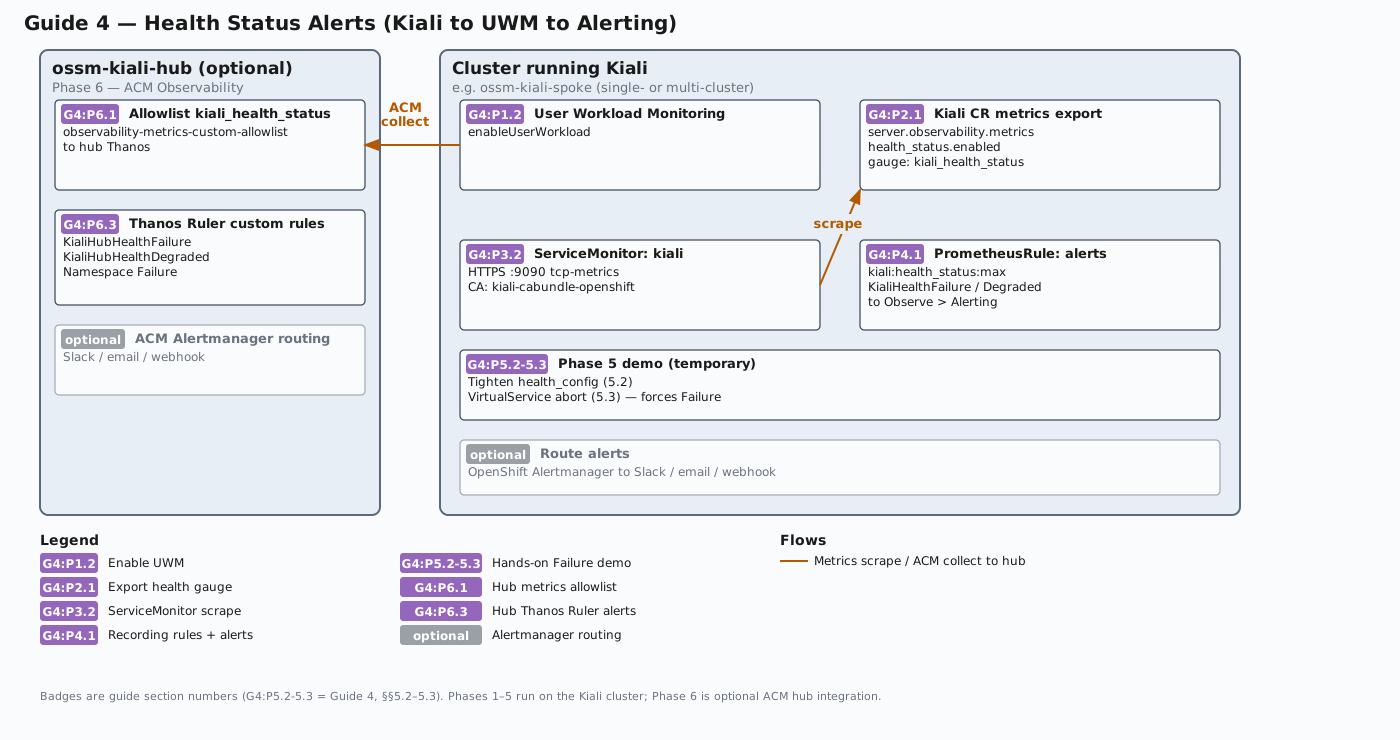
The diagram below shows the alerting pipeline this guide configures. Badges such as G4:P5.2-5.3 mark which guide section(s) install each piece (Guide 4, §§5.2–5.3). Phases 1–5 run on the cluster that hosts Kiali; Phase 6 is optional hub integration with ACM; Phase 7 is optional NetObserv Network Health on the Kiali cluster. Click the diagram to open a full-size SVG in a new tab.
Prerequisites
--context=ossm-kiali-spoke (same name as the hub/spoke guide); substitute your cluster’s context if needed, and skip Phase 6. Phase 7 (NetObserv Network Health) is optional on the same cluster after Phases 1–4.
- OpenShift 4.19 or later with cluster monitoring (
openshift-monitoring). - Kiali installed with access to mesh namespaces
- A mesh with workloads Kiali can score. The Phase 5 demo commands use the Bookinfo application — if you want to follow them exactly, have Bookinfo deployed (the hub/spoke guide installs it, or see the Istio Bookinfo sample)
ocCLI with a kubeconfig context for the cluster where Kiali runs (commands use--context=ossm-kiali-spoke; substitute your context name if different)- Phase 6 only: a kubeconfig context for the ACM hub (
--context=ossm-kiali-hub) and ACM Observability (MultiClusterObservability) ready on the hub (set up in the hub/spoke guide) - Phase 7 only: OpenShift 4.19 or later on the Kiali cluster, access to
redhat-operatorsfor the Network Observability Operator, and Phases 1–4 already completed on that cluster (Guides 1–3 are not required)
Set namespace variables for the cluster that runs Kiali:
KIALI_NS— namespace of the Kiali server (typicallyistio-system).KIALI_CR_NS— namespace of the Kiali CR. Often the same asKIALI_NS.
export KIALI_CR_NS=$(oc --context=ossm-kiali-spoke get kiali -A -o jsonpath='{.items[0].metadata.namespace}')
export KIALI_NS=$(oc --context=ossm-kiali-spoke get kiali -A -o jsonpath='{.items[0].spec.deployment.namespace}')
echo "KIALI_CR_NS=${KIALI_CR_NS}"
echo "KIALI_NS=${KIALI_NS}"
Non-default instance names: This guide assumes the default Kiali instance name kiali. If your Kiali CR uses a different spec.deployment.instance_name, the Kiali installer names resources after that value. The resources in this guide affected by the instance name are:
- Service —
<kiali-instance-name>(default:kiali) - CA ConfigMap —
<kiali-instance-name>-cabundle-openshift(default:kiali-cabundle-openshift) - ServiceMonitor
serverName—<kiali-instance-name>.<namespace>.svc(default:kiali.istio-system.svc)
Substitute accordingly. The Kiali CR name itself may or may not be kiali and is independent of the instance name — use oc get kiali -A to confirm the name of your Kiali CR.
Phase 1: Enable User Workload Monitoring
Enable UWM on each cluster where Kiali runs. UWM’s Prometheus scrapes targets selected by user-namespace ServiceMonitor / PodMonitor resources (including Kiali’s metrics endpoint) and evaluates user PrometheusRule objects. You do not need UWM on an ACM hub unless Kiali also runs there.
1.1 Check whether UWM is enabled
oc --context=ossm-kiali-spoke get configmap cluster-monitoring-config \
  -n openshift-monitoring \
  -o jsonpath='{.data.config\.yaml}' 2>/dev/null | \
  grep -q "enableUserWorkload: true" && \
  echo "Already enabled" || echo "Not enabled"
1.2 Enable UWM
If not enabled, ensure enableUserWorkload: true is set under data.config.yaml in cluster-monitoring-config. Do not replace the whole ConfigMap if it already has other settings — merge this key into the existing config.yaml.
If the ConfigMap does not exist yet:
oc --context=ossm-kiali-spoke create configmap cluster-monitoring-config \
  -n openshift-monitoring \
  --from-literal=config.yaml="enableUserWorkload: true"
If it already exists, patch it to set the flag without removing other keys:
oc --context=ossm-kiali-spoke get configmap cluster-monitoring-config \
  -n openshift-monitoring -o json \
  | jq '.data["config.yaml"] as $cfg
        | if ($cfg | test("enableUserWorkload"))
          then .data["config.yaml"] = ($cfg | sub("enableUserWorkload:\\s*\\w+"; "enableUserWorkload: true"))
          else .data["config.yaml"] = ($cfg + "\nenableUserWorkload: true\n")
          end' \
  | oc --context=ossm-kiali-spoke apply -f -
1.3 Wait for UWM Prometheus
Wait for the user-workload Prometheus to become ready:
until oc --context=ossm-kiali-spoke get pods \
  -l app.kubernetes.io/name=prometheus \
  -n openshift-user-workload-monitoring \
  --no-headers 2>/dev/null | grep -q .; do
  echo "Waiting for UWM Prometheus pods..."
  sleep 5
done

oc --context=ossm-kiali-spoke wait pod \
  --for=condition=Ready \
  -l app.kubernetes.io/name=prometheus \
  -n openshift-user-workload-monitoring \
  --timeout=300s
1.4 Verify UWM
Confirm User Workload Monitoring is enabled and its Prometheus pods are Ready:
oc --context=ossm-kiali-spoke get configmap cluster-monitoring-config \
  -n openshift-monitoring \
  -o jsonpath='{.data.config\.yaml}'
echo

oc --context=ossm-kiali-spoke get pods \
  -l app.kubernetes.io/name=prometheus \
  -n openshift-user-workload-monitoring
You should see enableUserWorkload: true and at least one Ready Prometheus pod in openshift-user-workload-monitoring.
Phase 2: Enable Kiali health-status metrics
The kiali_health_status Prometheus gauge is the per-entity health score Kiali computes. Each time series represents one mesh entity with these labels:
cluster— cluster name as known to Kialihealth_type—app,service,workload, ornamespacenamespace— entity namespacename— entity name (forhealth_type="namespace", this is the namespace name)
Gauge values are 0–3 as listed in Overview. NA is not written as a gauge value — after max_consecutive_na consecutive refresh cycles (default: 3) when an entity is unavailable or missing, Kiali stops exporting its series.
This gauge needs to be exported in order for Prometheus to scrape its value. This export is controlled by server.observability.metrics.health_status.enabled (default: false). The health cache that computes the gauge is enabled by default; you only need to re-enable it if you previously disabled it via kiali_internal.health_cache.enabled: false.
Both flags are required: server.observability.metrics.enabled: true tells the Kiali installer (operator or server Helm chart) to expose the metrics Service port and to add pod scrape annotations, and server.observability.metrics.health_status.enabled: true activates the health gauge on that endpoint.
2.1 Patch the Kiali CR
Patch the Kiali CR (merge with your existing spec):
oc --context=ossm-kiali-spoke patch kiali kiali -n "${KIALI_CR_NS}" --type=merge -p '
spec:
  server:
    observability:
      metrics:
        enabled: true
        health_status:
          enabled: true
'
2.2 Wait for reconciliation
oc --context=ossm-kiali-spoke wait kiali kiali \
  -n "${KIALI_CR_NS}" \
  --for=condition=Successful \
  --timeout=300s
2.3 Verify health-status metrics are enabled
Confirm the CR settings and that the Service exposes the metrics port:
oc --context=ossm-kiali-spoke get kiali kiali -n "${KIALI_CR_NS}" \
  -o jsonpath='{.spec.server.observability.metrics}' ; echo

oc --context=ossm-kiali-spoke get svc kiali -n "${KIALI_NS}" \
  -o jsonpath='{range .spec.ports[*]}{.name}{" "}{.port}{"\n"}{end}'
You should see metrics.enabled and health_status.enabled both true, and a tcp-metrics (or http-metrics) port on 9090.
Phase 3: Scrape Kiali with a ServiceMonitor
Create a ServiceMonitor in the Kiali server namespace so User Workload Monitoring scrapes Kiali’s HTTPS metrics endpoint (tcp-metrics / port 9090) and ingests kiali_health_status into UWM Prometheus. Without this scrape, Prometheus never ingests the gauge and it never appears under Observe or in alert evaluation.
Kiali’s metrics endpoint uses HTTPS (service-serving certificates on OpenShift), so the ServiceMonitor must include TLS configuration with the correct CA. The Kiali installation creates a ConfigMap named <kial-instance-name>-cabundle-openshift (default: kiali-cabundle-openshift) that OpenShift automatically populates with the service CA via service.beta.openshift.io/inject-cabundle. The ServiceMonitor below references this ConfigMap.
The relabelings copy app and version from the Kiali Service labels (app.kubernetes.io/name / app, and app.kubernetes.io/version / version) onto scraped time series so the Kiali Internal Metrics workload dashboard can filter by the same labels as the Kiali deployment.
tlsConfig.caFile in the ServiceMonitor. UWM blocks filesystem access (arbitraryFSAccessThroughSMs.deny: true), so caFile paths that work for platform Prometheus will be rejected. Use the ConfigMap-based tlsConfig.ca form shown below instead.
3.1 Confirm the CA ConfigMap
Confirm the CA ConfigMap has the injected cert before creating the ServiceMonitor that references it. It is normally already present after install; wait if OpenShift has not filled it yet:
until oc --context=ossm-kiali-spoke get configmap kiali-cabundle-openshift \
  -n "${KIALI_NS}" \
  -o jsonpath='{.data.service-ca\.crt}' 2>/dev/null | grep -q .; do
  echo "Waiting for service-ca.crt in kiali-cabundle-openshift..."
  sleep 2
done
echo "CA bundle ready"
3.2 Apply the ServiceMonitor
oc --context=ossm-kiali-spoke apply -f - <<EOF
apiVersion: monitoring.coreos.com/v1
kind: ServiceMonitor
metadata:
  name: kiali
  namespace: ${KIALI_NS}
spec:
  endpoints:
  - interval: 30s
    port: tcp-metrics
    relabelings:
    - action: replace
      regex: "(.+);.*|.*;(.+)"
      replacement: "\${1}\${2}"
      separator: ";"
      sourceLabels:
      - __meta_kubernetes_service_label_app_kubernetes_io_name
      - __meta_kubernetes_service_label_app
      targetLabel: app
    - action: replace
      regex: "(.+)"
      replacement: "\${1}"
      sourceLabels:
      - __meta_kubernetes_service_label_app_kubernetes_io_name
      targetLabel: app_kubernetes_io_name
    - action: replace
      regex: "(.+);.*|.*;(.+)"
      replacement: "\${1}\${2}"
      separator: ";"
      sourceLabels:
      - __meta_kubernetes_service_label_app_kubernetes_io_version
      - __meta_kubernetes_service_label_version
      targetLabel: version
    - action: replace
      regex: "(.+)"
      replacement: "\${1}"
      sourceLabels:
      - __meta_kubernetes_service_label_app_kubernetes_io_version
      targetLabel: app_kubernetes_io_version
    scheme: https
    tlsConfig:
      ca:
        configMap:
          key: service-ca.crt
          name: kiali-cabundle-openshift
      serverName: kiali.${KIALI_NS}.svc
  namespaceSelector:
    matchNames:
    - ${KIALI_NS}
  selector:
    matchLabels:
      app.kubernetes.io/name: kiali
EOF
3.3 Verify the scrape
Kiali’s health cache refreshes every 3 minutes by default. After the first refresh cycle completes and a UWM scrape picks it up (another 30 seconds), kiali_health_status series will appear. Allow up to 5 minutes after applying the ServiceMonitor before checking.
In the OpenShift console, go to Observe > Metrics and add the query:
kiali_health_status
Or query UWM Prometheus with oc:
PROM_POD=$(oc --context=ossm-kiali-spoke -n openshift-user-workload-monitoring \
  get pods -l app.kubernetes.io/name=prometheus \
  -o jsonpath='{.items[0].metadata.name}')

oc --context=ossm-kiali-spoke -n openshift-user-workload-monitoring \
  exec -c prometheus "${PROM_POD}" -- \
  wget -qO- 'http://localhost:9090/api/v1/query?query=kiali_health_status' | jq .
Either way, you should see series with health_type, name, and exported_namespace labels. If the result is empty:
- Confirm Kiali shows health for the demo namespace in the Kiali UI
- Confirm
server.observability.metrics.enabledandserver.observability.metrics.health_status.enabledare both true in the Kiali CR - Confirm UWM is scraping the Kiali target. In the OpenShift console, go to Observe > Targets and look for a target with endpoint
https://...:9090/metricsin theistio-systemnamespace — it should show UP. If it shows DOWN with a TLS error, check theserverNameand CA ConfigMap. If the ServiceMonitor was rejected entirely (no target appears), check for events on the ServiceMonitor withoc describe servicemonitor kiali -n ${KIALI_NS}— a common cause is usingtlsConfig.caFileinstead of the ConfigMapcaform. - TLS mismatches usually mean a wrong
serverName(must be<kiali-instance-name>.<namespace>.svc), a wrong CA ConfigMap name (must match your instance:<kiali-instance-name>-cabundle-openshift), or a ConfigMap that does not yet have the injectedservice-ca.crtkey
Phase 4: Recording rules and baseline alerts
Create a PrometheusRule in the Kiali server namespace. This defines recording rules — pre-computed aggregations that Prometheus evaluates on a schedule and stores as new time series — and a set of baseline alerts you can use as a starting point and customize for your environment. Those alerts surface under Observe > Alerting; the Kiali installer (operator or Helm chart) does not install this rule for you.
4.1 Apply the baseline PrometheusRule
namespace label with the namespace of the ServiceMonitor / PrometheusRule (usually istio-system). Kiali’s original mesh namespace is preserved as exported_namespace. Use exported_namespace in PromQL, recording rules, and alert annotations — not namespace.
Apply this PrometheusRule in ${KIALI_NS} — the same namespace as the ServiceMonitor. UWM only lets a rule query metrics whose Prometheus namespace label matches the rule’s own namespace. Put the rule anywhere else and the expressions see no series.
Also set the label openshift.io/prometheus-rule-evaluation-scope: leaf-prometheus so UWM’s Prometheus evaluates the rules locally (faster than Thanos Ruler for user-workload alerts).
The recording rules use max by (cluster, exported_namespace, health_type, name) to aggregate across Kiali replicas — if you run more than one replica, each pod exports its own series for the same entity, and max ensures the worst health wins (Failure 3 beats Degraded 2). This pattern stays correct for a single replica too. Always keep cluster in the aggregation set in multi-cluster environments.
oc --context=ossm-kiali-spoke apply -f - <<EOF
apiVersion: monitoring.coreos.com/v1
kind: PrometheusRule
metadata:
  name: kiali-health-status
  namespace: ${KIALI_NS}
  labels:
    openshift.io/prometheus-rule-evaluation-scope: leaf-prometheus
spec:
  groups:
  - name: kiali.health.recording
    rules:
    - record: kiali:health_status:max
      expr: |
        max by (cluster, exported_namespace, health_type, name) (kiali_health_status)
    - record: kiali:health_status:namespace_max
      expr: |
        max by (cluster, exported_namespace, name) (
          kiali_health_status{health_type="namespace"}
        )
  - name: kiali.health.alerts
    rules:
    - alert: KialiHealthFailure
      expr: |
        kiali:health_status:max{health_type=~"app|service|workload"} == 3
      for: 5m
      labels:
        severity: critical
      annotations:
        summary: >-
          {{ \$labels.health_type }} {{ \$labels.name }} in {{ \$labels.exported_namespace }}
          (cluster {{ \$labels.cluster }}) is in Failure
        description: >-
          Kiali reported Failure (kiali_health_status == 3) for at least 5 minutes.
    - alert: KialiHealthDegraded
      expr: |
        kiali:health_status:max{health_type=~"app|service|workload"} == 2
      for: 10m
      labels:
        severity: warning
      annotations:
        summary: >-
          {{ \$labels.health_type }} {{ \$labels.name }} in {{ \$labels.exported_namespace }}
          (cluster {{ \$labels.cluster }}) is Degraded
        description: >-
          Kiali reported Degraded (kiali_health_status == 2) for at least 10 minutes.
    - alert: KialiNamespaceHealthFailure
      expr: |
        kiali:health_status:namespace_max == 3
      for: 5m
      labels:
        severity: critical
      annotations:
        summary: >-
          Namespace {{ \$labels.exported_namespace }} (cluster {{ \$labels.cluster }})
          is in Failure
        description: >-
          Kiali namespace aggregate health status is Failure (kiali_health_status == 3)
          for at least 5 minutes.
EOF
\$labels... so your shell does not expand $labels before oc apply. Prometheus still receives normal {{ $labels... }} templates. If you put the same YAML in a file and apply with oc apply -f, use $labels without the backslash.
That PrometheusRule creates two rule groups:
kiali.health.recording— recording ruleskiali:health_status:maxandkiali:health_status:namespace_max(per-entity aggregates used by the alerts below)kiali.health.alerts— three baseline alerts:KialiHealthFailure— fires when an app, service, or workload has Failure health status (== 3), severitycritical,for: 5mKialiHealthDegraded— fires when an app, service, or workload has Degraded health status (== 2), severitywarning,for: 10mKialiNamespaceHealthFailure— fires when a namespace aggregate has Failure health status (== 3), severitycritical,for: 5m
Not Ready (== 1) is omitted from these baseline alerts. It is often transient during rollouts; add a custom alert if you need it.
4.2 Verify the rules
Confirm the PrometheusRule is present, then check that the recording rule produces series (console Observe > Metrics, or oc):
kiali:health_status:max
oc --context=ossm-kiali-spoke get prometheusrule kiali-health-status -n "${KIALI_NS}"

PROM_POD=$(oc --context=ossm-kiali-spoke -n openshift-user-workload-monitoring \
  get pods -l app.kubernetes.io/name=prometheus \
  -o jsonpath='{.items[0].metadata.name}')

oc --context=ossm-kiali-spoke -n openshift-user-workload-monitoring \
  exec -c prometheus "${PROM_POD}" -- \
  wget -qO- 'http://localhost:9090/api/v1/query?query=kiali:health_status:max' | jq .
You should see aggregated series with cluster, exported_namespace, health_type, and name. Alerts stay pending until health is Degraded/Failure long enough to satisfy for (see Phase 5 to trigger one).
Phase 5: Custom alerts and a hands-on trigger demo
This phase has two parts: first, adding your own alerts tailored to your namespaces and severities. Then, an optional hands-on demo that forces Failure health so you can see KialiHealthFailure fire under Observe > Alerting.
5.1 Add custom alerts
- Edit the
kiali-health-statusPrometheusRule(or create a new one in${KIALI_NS}with the sameleaf-prometheuslabel). - Add another
- alert:entry underkiali.health.alerts(or a new group). oc applythe manifest.
Useful knobs:
- Filter by label — e.g.
exported_namespace="bookinfo",name="reviews",cluster="spoke"(under UWM, mesh namespace isexported_namespace) for— how long the alert expression must stay true before the alert actually fires. While it is true but that duration has not elapsed, the alert is only pending. If the expression becomes false beforeforcompletes, the pending alert is cleared and the clock resets. Longerforvalues ignore brief blips; shorter values (as in the demo below) surface problems faster.severity— a label on the alert (critical,warning, orinfo). The OpenShift console uses it to filter and prioritize alerts under Observe > Alerting (for example, show only critical). It does not change when the alert fires; that is controlled byexprandfor.
Alert expressions for kiali_health_status operate on the gauge value (0–3), not on raw HTTP error percentages. To change when Kiali marks Degraded/Failure, adjust health_config.rate tolerances; to change when OpenShift fires an alert, adjust the alert expr / for.
The two examples below each create a separate PrometheusRule so you do not have to hand-edit the one created in Phase 4. Use \$labels in the heredoc (see the “shell note” from Phase 4).
Example — Failure only in bookinfo:
Fires when any app, service, or workload in the bookinfo namespace reaches Failure health status for at least 5 minutes.
oc --context=ossm-kiali-spoke apply -f - <<EOF
apiVersion: monitoring.coreos.com/v1
kind: PrometheusRule
metadata:
  name: kiali-health-status-bookinfo
  namespace: ${KIALI_NS}
  labels:
    openshift.io/prometheus-rule-evaluation-scope: leaf-prometheus
spec:
  groups:
  - name: kiali.health.bookinfo
    rules:
    - alert: KialiBookinfoHealthFailure
      expr: |
        kiali:health_status:max{
          health_type=~"app|service|workload",
          exported_namespace="bookinfo"
        } == 3
      for: 5m
      labels:
        severity: critical
      annotations:
        summary: "Bookinfo {{ \$labels.health_type }} {{ \$labels.name }} is in Failure"
EOF
Example — sustained Not Ready for workloads:
Fires when any workload stays in Not Ready health status for at least 15 minutes, catching prolonged rollout or scaling issues that outlast normal transient periods.
oc --context=ossm-kiali-spoke apply -f - <<EOF
apiVersion: monitoring.coreos.com/v1
kind: PrometheusRule
metadata:
  name: kiali-health-status-not-ready
  namespace: ${KIALI_NS}
  labels:
    openshift.io/prometheus-rule-evaluation-scope: leaf-prometheus
spec:
  groups:
  - name: kiali.health.not-ready
    rules:
    - alert: KialiWorkloadNotReady
      expr: |
        kiali:health_status:max{health_type="workload"} == 1
      for: 15m
      labels:
        severity: warning
      annotations:
        summary: "Workload {{ \$labels.name }} in {{ \$labels.exported_namespace }} is Not Ready"
EOF
Steps 5.2–5.4 below walk through a hands-on demo: force a Failure, shorten for on KialiHealthFailure so you are not waiting five minutes, view the alert in the OpenShift console, then clean up.
5.2 Shorten the Failure alert for the demo
Phase 4 sets for: 5m on KialiHealthFailure, so the Failure expression must hold for five minutes before the alert leaves pending state and fires. For the demo, temporarily set for to 1m so you are not waiting too long to see the alert fire:
oc --context=ossm-kiali-spoke get prometheusrule kiali-health-status -n "${KIALI_NS}" -o json \
  | jq 'del(.status)
        | (.spec.groups[] | select(.name == "kiali.health.alerts").rules[]
           | select(.alert == "KialiHealthFailure").for) = "1m"' \
  | oc --context=ossm-kiali-spoke apply -f -
Note that for production alerts, the recommendations remain for: 5m (Failure) and for: 10m (Degraded).
5.3 Force Failure health
Tighten traffic-health tolerances for the demo namespace so even a small 5xx rate becomes a Failure which then generate errors.
Warning: The patch below replaces spec.health_config on the Kiali CR (including any existing rate list). Back up the current health_config first so it can be restored during the Cleanup phase, then apply the patch and wait for reconciliation:
oc --context=ossm-kiali-spoke get kiali kiali -n "${KIALI_CR_NS}" -o json \
  | jq '.spec.health_config // {}' > /tmp/kiali-health-config-backup.json

oc --context=ossm-kiali-spoke patch kiali kiali -n "${KIALI_CR_NS}" --type=merge -p '
spec:
  health_config:
    compute:
      duration: 10m
    rate:
    - namespace: "bookinfo"
      kind: ".*"
      name: ".*"
      tolerance:
      - code: "^5\\d\\d$"
        direction: ".*"
        protocol: "http"
        degraded: 0
        failure: 1
'

oc --context=ossm-kiali-spoke wait kiali kiali \
  -n "${KIALI_CR_NS}" \
  --for=condition=Successful \
  --timeout=300s
health_config.rate tolerances, a failure value of 0 with a degraded value of 0 does not trigger Failure — instead, matching traffic is marked Degraded (see issue #10072). Use failure: 1 as the lowest effective Failure threshold (triggers Failure for any 5xx error rate at or above 1%). See Traffic Health for the full priority table.
compute.duration and hub Thanos: The health calculation duration must be
compatible with the ACM federation cadence. See Scrape Intervals
before changing the federation interval or this duration.
Now inject abort faults on Bookinfo ratings (or another service you care about):
oc --context=ossm-kiali-spoke apply -f - <<'EOF'
apiVersion: networking.istio.io/v1
kind: VirtualService
metadata:
  name: kiali-health-alert-demo
  namespace: bookinfo
spec:
  hosts:
  - ratings
  http:
  - fault:
      abort:
        httpStatus: 500
        percentage:
          value: 100
    route:
    - destination:
        host: ratings
EOF
Send traffic through the productpage > reviews > ratings path. Only some Bookinfo reviews versions call ratings, so not every request produces a ratings 5xx but this is enough for the demo.
If you already have a traffic generator running (such as the traffic-gen deployment from the hub/spoke guide), it is already driving requests through this path — skip the command below. Otherwise, generate traffic from inside the cluster:
oc --context=ossm-kiali-spoke -n bookinfo exec deploy/ratings-v1 -c ratings -- \
  sh -c 'for i in $(seq 1 60); do curl -s -o /dev/null -w "%{http_code}\n" http://productpage:9080/productpage; sleep 2; done'
Kiali’s health cache refreshes every 3m (controlled by health_config.compute.refresh_interval). After generating errors, wait for a refresh cycle (or watch the Kiali UI) until the ratings (or related) entity shows Failure. Then go to Observe > Metrics in the OpenShift console and run this query to confirm Failure series exist:
kiali:health_status:max{exported_namespace="bookinfo", health_type=~"app|service|workload"} == 3
Because we shortened for to 1m on the alert rule above, the Failure condition must stay true for one full minute before KialiHealthFailure fires (until then it stays pending).
5.4 View the alert in the OpenShift console
- Log in to the OpenShift web console with a user that can view alerting (kubeadmin or a monitoring-capable role).
- Go to Observe > Alerting > Alerts.
- Filter or search for
KialiHealthFailure. With the zero-tolerancehealth_configapplied above, any 5xx traffic goes straight to Failure —KialiHealthDegradedshould not appear for the affected entities. - Open the alert and confirm
exported_namespace(mesh namespace),name,health_type,cluster, and the annotation summary. The Prometheusnamespacelabel will be the rule namespace (for exampleistio-system).
You can also confirm under Observe > Metrics with:
ALERTS{alertname=~"KialiHealthFailure|KialiHealthDegraded"}
Single-cluster readers can stop here, or continue to Phase 7 for NetObserv Network Health. Multi-cluster readers who want hub Thanos queries and/or hub alerts can continue to Phase 6 (Phase 7 remains available afterward on each Kiali cluster).
Phase 6: Multi-cluster with ACM Observability
Complete Phases 1–3 on each managed cluster that should export kiali_health_status (UWM, metric export, ServiceMonitor). Phases 4–5 are optional if you only want hub alerts and do not need per-cluster Observe > Alerting.
MCOA federates metrics from each managed cluster’s UWM to hub Thanos. This phase adds the health recording group to the shared mesh-observability aggregation rule and reuses the shared user-workload ScrapeConfig, then configures hub Thanos Ruler alert rules.
If you already applied Phase 4 on the managed clusters, you can keep those local alerts, replace them with hub-only rules, or run both — see the trade-offs in Overview. Hub evaluation follows the MCOA federation cadence; see Scrape Intervals for the timing implications.
6.1 Add kiali_health_status MCOA Federation Resources
kiali-istio-aggregation PrometheusRule and kiali-istio-federation ScrapeConfig were created in Guide 1, §1.5 Configure MCOA Federation. Add the health recording group and health match expression to those existing resources; do not create another namespace-specific rule. If you followed that Guide, skip the resource creation below and go directly to §6.2.
On the hub, identify the MCOA placement (if you already did this in the hub/spoke guide, re-export the variables):
ADDON_JSON=$(oc --context=ossm-kiali-hub get clustermanagementaddon \
  multicluster-observability-addon -o json)
MCOA_PLACEMENT_NAME=$(echo "${ADDON_JSON}" | \
  jq -r '.spec.installStrategy.placements[0].name')
MCOA_PLACEMENT_NS=$(echo "${ADDON_JSON}" | \
  jq -r '.spec.installStrategy.placements[0].namespace')
For a standalone health-only setup, create the shared aggregation PrometheusRule in mesh-observability. MCOA propagates it into that namespace on each managed cluster. The max without expression deduplicates samples across Kiali HA replicas:
oc --context=ossm-kiali-hub apply -f - <<'EOF'
apiVersion: monitoring.coreos.com/v1
kind: PrometheusRule
metadata:
  annotations:
    observability.open-cluster-management.io/target-namespace: mesh-observability
  labels:
    app.kubernetes.io/component: user-workload-metrics-collector
    app.kubernetes.io/managed-by: kiali-mcoa-federation
    openshift.io/prometheus-rule-evaluation-scope: leaf-prometheus
  name: kiali-istio-aggregation
  namespace: open-cluster-management-observability
spec:
  groups:
  - interval: 30s
    name: kiali.aggregation
    rules:
    - expr: max without (pod, pod_template_hash, instance, job, node) (kiali_health_status)
      record: kiali:kiali_health_status
EOF
Use the existing kiali-istio-federation user-workload ScrapeConfig (or create it once for a health-only setup) to federate the aggregated kiali:kiali_health_status series and relabel it back to kiali_health_status for Thanos Ruler queries. Merge this match expression with the core and Kiali metric matches; do not create a second ScrapeConfig with the same name.
oc --context=ossm-kiali-hub apply -f - <<'EOF'
apiVersion: monitoring.rhobs/v1alpha1
kind: ScrapeConfig
metadata:
  labels:
    app.kubernetes.io/component: user-workload-metrics-collector
    app.kubernetes.io/managed-by: kiali-mcoa-federation
  name: kiali-istio-federation
  namespace: open-cluster-management-observability
spec:
  honorLabels: true
  jobName: kiali-istio-federation
  metricRelabelings:
  - action: replace
    regex: 'kiali:(.*)'
    replacement: '${1}'
    sourceLabels: [__name__]
    targetLabel: __name__
  metricsPath: /federate
  params:
    match[]:
    - '{__name__="kiali:kiali_health_status"}'
EOF
Register both resources with the MCOA placement (the bash code below is idempotent):
add_mcoa_ref() {
  local group=$1 resource=$2 name=$3
  local exists idx configs op path
  ADDON_JSON=$(oc --context=ossm-kiali-hub get clustermanagementaddon \
    multicluster-observability-addon -o json)
  exists=$(echo "${ADDON_JSON}" | jq -r \
    --arg g "${group}" --arg r "${resource}" --arg n "${name}" \
    --arg ns "open-cluster-management-observability" \
    --arg pn "${MCOA_PLACEMENT_NAME}" --arg pns "${MCOA_PLACEMENT_NS}" \
    '[.spec.installStrategy.placements[] |
      select(.name == $pn and .namespace == $pns) |
      .configs[]? |
      select(.group == $g and .resource == $r and .name == $n and .namespace == $ns)] | length')
  if [ "${exists}" -eq 0 ]; then
    idx=$(echo "${ADDON_JSON}" | jq -r \
      --arg pn "${MCOA_PLACEMENT_NAME}" --arg pns "${MCOA_PLACEMENT_NS}" \
      '.spec.installStrategy.placements | to_entries[] |
        select(.value.name == $pn and .value.namespace == $pns) | .key')
    configs=$(echo "${ADDON_JSON}" | jq -r \
      --argjson i "${idx}" \
      '.spec.installStrategy.placements[$i].configs | type == "array"')
    if [ "${configs}" = true ]; then
      op="add"; path="/spec/installStrategy/placements/${idx}/configs/-"
    else
      op="add"; path="/spec/installStrategy/placements/${idx}/configs"
    fi
    oc --context=ossm-kiali-hub patch clustermanagementaddon \
      multicluster-observability-addon --type=json -p="[{
        \"op\": \"${op}\", \"path\": \"${path}\",
        \"value\": {\"group\": \"${group}\", \"resource\": \"${resource}\",
                    \"name\": \"${name}\",
                    \"namespace\": \"open-cluster-management-observability\"}
      }]"
    echo "Added ${resource}/${name} to placement"
  else
    echo "Reference ${resource}/${name} already present — skipping"
  fi
}

add_mcoa_ref monitoring.coreos.com prometheusrules kiali-istio-aggregation
add_mcoa_ref monitoring.rhobs scrapeconfigs kiali-istio-federation
6.2 Verify on the hub
After applying the MCOA resources, follow the timing guidance in Scrape Intervals before verifying the pipeline:
# Confirm source PrometheusRule and ScrapeConfig exist on the hub
oc --context=ossm-kiali-hub get prometheusrule kiali-istio-aggregation \
  -n open-cluster-management-observability
oc --context=ossm-kiali-hub get scrapeconfig kiali-istio-federation \
  -n open-cluster-management-observability

# Confirm the PrometheusRule propagated to the shared aggregation namespace on the spoke
oc --context=ossm-kiali-spoke get prometheusrule kiali-istio-aggregation \
  -n mesh-observability

# Query hub Thanos for kiali_health_status (relabeled from kiali:kiali_health_status by the ScrapeConfig)
oc --context=ossm-kiali-hub get --raw \
  "/api/v1/namespaces/open-cluster-management-observability/services/http:observability-thanos-query-frontend:9090/proxy/api/v1/query?query=kiali_health_status" \
  | jq .
Confirm the kiali_health_status metric appears and includes cluster identity labels so you can filter by managed cluster.
6.3 Apply hub alert rules
kiali_health_status into kiali:health_status:max. Those recording rules stay on each cluster’s UWM Prometheus — they are not pushed to the hub. For the hub alerts below, we take a simpler approach and inline the max by (...) aggregation directly in each alert expression rather than creating separate recording rules on the hub. You can opt to use recording rules on the hub as well if you prefer that approach.
Create ACM Thanos Ruler custom rules on the hub. ACM loads the ConfigMap named thanos-ruler-custom-rules in open-cluster-management-observability (data key must be custom_rules.yaml). These alerts parallel the Phase 4 baseline alerts but use distinct names so you can tell hub alerts from managed-cluster alerts:
oc --context=ossm-kiali-hub apply -f - <<'EOF'
apiVersion: v1
kind: ConfigMap
metadata:
  name: thanos-ruler-custom-rules
  namespace: open-cluster-management-observability
data:
  custom_rules.yaml: |
    groups:
    - name: kiali.health.hub.alerts
      rules:
      - alert: KialiHubHealthFailure
        expr: |
          max by (cluster, exported_namespace, health_type, name) (
            kiali_health_status{health_type=~"app|service|workload"}
          ) == 3
        for: 5m
        labels:
          severity: critical
        annotations:
          summary: >-
            {{ $labels.health_type }} {{ $labels.name }} in {{ $labels.exported_namespace }}
            (cluster {{ $labels.cluster }}) has Failure health status
          description: >-
            Hub Thanos Ruler: Kiali reported Failure (kiali_health_status == 3)
            for at least 5 minutes.
      - alert: KialiHubHealthDegraded
        expr: |
          max by (cluster, exported_namespace, health_type, name) (
            kiali_health_status{health_type=~"app|service|workload"}
          ) == 2
        for: 10m
        labels:
          severity: warning
        annotations:
          summary: >-
            {{ $labels.health_type }} {{ $labels.name }} in {{ $labels.exported_namespace }}
            (cluster {{ $labels.cluster }}) has Degraded health status
          description: >-
            Hub Thanos Ruler: Kiali reported Degraded (kiali_health_status == 2)
            for at least 10 minutes.
      - alert: KialiHubNamespaceHealthFailure
        expr: |
          max by (cluster, exported_namespace, name) (
            kiali_health_status{health_type="namespace"}
          ) == 3
        for: 5m
        labels:
          severity: critical
        annotations:
          summary: >-
            Namespace {{ $labels.exported_namespace }} (cluster {{ $labels.cluster }})
            has Failure health status
          description: >-
            Hub Thanos Ruler: Kiali namespace aggregate health status is Failure
            (kiali_health_status == 3) for at least 5 minutes.
EOF
thanos-ruler-custom-rules already exists, merge the kiali.health.hub.alerts group into the existing custom_rules.yaml instead of replacing the ConfigMap with a shorter file that only contains the Kiali group.
That ConfigMap creates one rule group, kiali.health.hub.alerts, with three baseline alerts:
KialiHubHealthFailure— app, service, or workload Failure (== 3), severitycritical,for: 5mKialiHubHealthDegraded— app, service, or workload Degraded (== 2), severitywarning,for: 10mKialiHubNamespaceHealthFailure— namespace aggregate Failure (== 3), severitycritical,for: 5m
6.4 Verify hub alerts
Confirm the ConfigMap is present:
oc --context=ossm-kiali-hub -n open-cluster-management-observability \
  get configmap thanos-ruler-custom-rules -o yaml
After ACM has collected Failure/Degraded samples and the alert for duration has elapsed, check for firing alerts on the hub (not the managed cluster’s Observe > Alerting):
- ACM Observability Grafana Explore — query
ALERTS{alertname=~"KialiHub.*"} - Or proxy Thanos:
oc --context=ossm-kiali-hub -n open-cluster-management-observability \
  get --raw \
  "/api/v1/namespaces/open-cluster-management-observability/services/http:observability-thanos-query-frontend:9090/proxy/api/v1/query?query=ALERTS%7Balertname%3D~%22KialiHub.%2A%22%7D" \
  | jq .
Phase 7: Network Health (NetObserv)
Network Health is NetObserv’s console dashboard under Observe > Network Health. It is distinct from OpenShift Observe > Alerting: Alerting shows firing/pending Prometheus alerts, while Network Health summarizes network and custom health signals (alerts and recording-rule scores) in Global / Namespaces / Nodes / Workloads tabs. This phase installs the Network Observability Operator on the same cluster that runs Kiali (ossm-kiali-spoke, or your substituted context — not the ACM hub), then re-applies the Phase 4 PrometheusRule with NetObserv metadata so Kiali health appears on that dashboard. Phases 1–4 must already be complete; Guides 1–3 and Phase 6 are not required. OpenShift 4.19+ and Network Observability Operator 1.11+ are required for Network Health.
7.1 Install the Network Observability Operator
Install the operator into openshift-netobserv-operator (required namespace for NetObserv OLM install) from redhat-operators on the stable channel (1.11+):
oc --context=ossm-kiali-spoke apply -f - <<'EOF'
apiVersion: v1
kind: Namespace
metadata:
  name: openshift-netobserv-operator
  labels:
    openshift.io/cluster-monitoring: "true"
---
apiVersion: operators.coreos.com/v1
kind: OperatorGroup
metadata:
  name: openshift-netobserv-operator
  namespace: openshift-netobserv-operator
spec: {}
---
apiVersion: operators.coreos.com/v1alpha1
kind: Subscription
metadata:
  name: netobserv-operator
  namespace: openshift-netobserv-operator
spec:
  channel: stable
  installPlanApproval: Automatic
  name: netobserv-operator
  source: redhat-operators
  sourceNamespace: openshift-marketplace
EOF
Wait for the FlowCollector CRD to be Established, then for the operator pod to become Ready:
until oc --context=ossm-kiali-spoke get crd \
  flowcollectors.flows.netobserv.io &>/dev/null; do
  echo "Waiting for FlowCollector CRD..."
  sleep 10
done

oc --context=ossm-kiali-spoke wait crd/flowcollectors.flows.netobserv.io \
  --for=condition=Established \
  --timeout=300s
echo "FlowCollector CRD ready"

until oc --context=ossm-kiali-spoke get pods \
  -l app=netobserv-operator \
  -n openshift-netobserv-operator \
  --no-headers 2>/dev/null | grep -q .; do
  echo "Waiting for NetObserv operator pod..."
  sleep 5
done

oc --context=ossm-kiali-spoke wait pod \
  --for=condition=Ready \
  -l app=netobserv-operator \
  -n openshift-netobserv-operator \
  --timeout=300s
echo "Network Observability Operator ready"
7.2 Create the FlowCollector
Create the cluster-scoped FlowCollector named cluster. This guide uses a Loki-less install: Network Health is driven by Prometheus alerts and recording rules, so Loki (and object storage) are not required. The console plugin still deploys and provides Observe > Network Health. Full Network Traffic flow-table features need Loki — see Installing the Network Observability Operator if you want that later.
oc --context=ossm-kiali-spoke apply -f - <<'EOF'
apiVersion: flows.netobserv.io/v1beta2
kind: FlowCollector
metadata:
  name: cluster
spec:
  namespace: netobserv
  agent:
    type: eBPF
  loki:
    enable: false
  consolePlugin:
    enable: true
EOF
Wait for the FlowCollector to report Ready and for the console plugin deployment to appear:
oc --context=ossm-kiali-spoke wait flowcollector/cluster \
  --for=condition=Ready \
  --timeout=600s
echo "FlowCollector Ready"

until oc --context=ossm-kiali-spoke get deploy -n netobserv \
  --no-headers 2>/dev/null | grep -qi netobserv-plugin; do
  echo "Waiting for NetObserv console plugin deployment..."
  sleep 10
done

PLUGIN_DEPLOY=$(oc --context=ossm-kiali-spoke get deploy -n netobserv \
  --no-headers -o custom-columns=NAME:.metadata.name 2>/dev/null \
  | grep -i netobserv-plugin | head -1)
oc --context=ossm-kiali-spoke rollout status deployment/"${PLUGIN_DEPLOY}" \
  -n netobserv \
  --timeout=300s
echo "NetObserv console plugin ready"
In the OpenShift console (refresh if needed), confirm Observe > Network Health is listed. Non-kubeadmin users need cluster-monitoring-view to query alerts for that page.
7.3 Annotate Kiali PrometheusRules for Network Health
Re-apply the Phase 4 PrometheusRule in ${KIALI_NS} with NetObserv labels and annotations. Keep the rule in the Kiali namespace so UWM can still evaluate it (leaf-prometheus); do not move it into the netobserv namespace. NetObserv discovers recording rules cluster-wide via the netobserv: "true" label.
Use exported_namespace in namespaceLabels so scores and alerts land on the Namespaces tab (UWM rewrites the mesh namespace to exported_namespace). Recording-rule thresholds map to the Kiali gauge: Not Ready 1 (info), Degraded 2 (warning), Failure 3 (critical), with upperBound: "3".
The netobserv: "true" labels are inert if NetObserv is not installed; with Network Health present they select the rules for that dashboard.
oc --context=ossm-kiali-spoke apply --server-side --force-conflicts -f - <<EOF
apiVersion: monitoring.coreos.com/v1
kind: PrometheusRule
metadata:
  name: kiali-health-status
  namespace: ${KIALI_NS}
  labels:
    netobserv: "true"
    openshift.io/prometheus-rule-evaluation-scope: leaf-prometheus
  annotations:
    netobserv.io/network-health: |
      {
        "kiali:health_status:max": {
          "summary": "Kiali health status for {{ \$labels.health_type }} {{ \$labels.name }} in {{ \$labels.exported_namespace }} is {{ \$value }}",
          "description": "Worst Kiali health score (0=Healthy, 1=Not Ready, 2=Degraded, 3=Failure) for the entity.",
          "netobserv_io_network_health": "{\"unit\":\"status\",\"upperBound\":\"3\",\"namespaceLabels\":[\"exported_namespace\"],\"recordingThresholds\":{\"info\":\"1\",\"warning\":\"2\",\"critical\":\"3\"}}"
        },
        "kiali:health_status:namespace_max": {
          "summary": "Kiali namespace health for {{ \$labels.exported_namespace }} is {{ \$value }}",
          "description": "Worst Kiali namespace aggregate health score (0=Healthy, 1=Not Ready, 2=Degraded, 3=Failure).",
          "netobserv_io_network_health": "{\"unit\":\"status\",\"upperBound\":\"3\",\"namespaceLabels\":[\"exported_namespace\"],\"recordingThresholds\":{\"info\":\"1\",\"warning\":\"2\",\"critical\":\"3\"}}"
        }
      }
spec:
  groups:
  - name: kiali.health.recording
    rules:
    - record: kiali:health_status:max
      expr: |
        max by (cluster, exported_namespace, health_type, name) (kiali_health_status)
      labels:
        netobserv: "true"
    - record: kiali:health_status:namespace_max
      expr: |
        max by (cluster, exported_namespace, name) (
          kiali_health_status{health_type="namespace"}
        )
      labels:
        netobserv: "true"
  - name: kiali.health.alerts
    rules:
    - alert: KialiHealthFailure
      expr: |
        kiali:health_status:max{health_type=~"app|service|workload"} == 3
      for: 5m
      labels:
        netobserv: "true"
        severity: critical
      annotations:
        summary: >-
          {{ \$labels.health_type }} {{ \$labels.name }} in {{ \$labels.exported_namespace }}
          (cluster {{ \$labels.cluster }}) is in Failure
        description: >-
          Kiali reported Failure (kiali_health_status == 3) for at least 5 minutes.
        netobserv_io_network_health: '{"namespaceLabels":["exported_namespace"],"threshold":"3","unit":"status","upperBound":"3"}'
    - alert: KialiHealthDegraded
      expr: |
        kiali:health_status:max{health_type=~"app|service|workload"} == 2
      for: 10m
      labels:
        netobserv: "true"
        severity: warning
      annotations:
        summary: >-
          {{ \$labels.health_type }} {{ \$labels.name }} in {{ \$labels.exported_namespace }}
          (cluster {{ \$labels.cluster }}) is Degraded
        description: >-
          Kiali reported Degraded (kiali_health_status == 2) for at least 10 minutes.
        netobserv_io_network_health: '{"namespaceLabels":["exported_namespace"],"threshold":"2","unit":"status","upperBound":"3"}'
    - alert: KialiNamespaceHealthFailure
      expr: |
        kiali:health_status:namespace_max == 3
      for: 5m
      labels:
        netobserv: "true"
        severity: critical
      annotations:
        summary: >-
          Namespace {{ \$labels.exported_namespace }} (cluster {{ \$labels.cluster }})
          is in Failure
        description: >-
          Kiali namespace aggregate health status is Failure (kiali_health_status == 3)
          for at least 5 minutes.
        netobserv_io_network_health: '{"namespaceLabels":["exported_namespace"],"threshold":"3","unit":"status","upperBound":"3"}'
EOF
\$labels... so the shell does not expand $labels before oc apply.
7.4 Verify Network Health
Confirm the annotated rule is present:
oc --context=ossm-kiali-spoke get prometheusrule kiali-health-status \
  -n "${KIALI_NS}" -o yaml | grep -E 'netobserv|network-health|exported_namespace'
You should see netobserv: "true", the netobserv.io/network-health annotation, and namespaceLabels referencing exported_namespace.
In the OpenShift console:
- Go to Observe > Network Health.
- Open the Namespaces tab.
- Confirm Kiali recording-rule scores (and any pending/firing
KialiHealth*alerts) appear for mesh namespaces such asbookinfo.
To force a Failure and watch it on Network Health as well as Observe > Alerting, run the Phase 5 hands-on demo (shorten for, tighten health_config, inject the ratings abort VirtualService, generate traffic). After the Failure condition holds for the alert for duration, KialiHealthFailure should show under Network Health > Namespaces for bookinfo.
Routing alerts to Slack, email, or webhooks
This section is optional. It shows how to route fired alerts to a third-party notification system such as Slack, email, or generic webhooks.
Which Alertmanager you configure depends on where your alerts emit from. If you set up hub alerts in Phase 6, follow the steps below to override ACM’s Alertmanager via the alertmanager-config secret in open-cluster-management-observability. If you set up managed-cluster or single-cluster alerts in Phases 1–5, configure OpenShift’s own Alertmanager instead — via the alertmanager-main secret in openshift-monitoring.
Extract the ACM Alertmanager config
On the hub, back up the current secret contents:
oc --context=ossm-kiali-hub -n open-cluster-management-observability \
  get secret alertmanager-config \
  -o jsonpath='{.data.alertmanager\.yaml}' | base64 -d > /tmp/alertmanager.yaml

cp /tmp/alertmanager.yaml /tmp/alertmanager.yaml.bak
Edit /tmp/alertmanager.yaml (or write a new file from one of the examples below) to define route and receivers. Replace the secret when finished:
oc --context=ossm-kiali-hub -n open-cluster-management-observability \
  create secret generic alertmanager-config \
  --from-file=alertmanager.yaml=/tmp/alertmanager.yaml \
  --dry-run=client -o yaml \
  | oc --context=ossm-kiali-hub -n open-cluster-management-observability replace -f -
ACM reloads Alertmanager from that secret. Keep /tmp/alertmanager.yaml.bak so you can restore the previous config the same way.
Example: Slack
Create an Incoming Webhook in Slack, then use a config like this (substitute your webhook URL and channel). The nested route sends only the Phase 6 KialiHub* alerts to Slack:
global:
  resolve_timeout: 5m
  slack_api_url: 'https://hooks.slack.com/services/REPLACE/WITH/WEBHOOK'

route:
  group_by: ['alertname', 'cluster']
  group_wait: 30s
  group_interval: 5m
  repeat_interval: 3h
  receiver: 'default'
  routes:
  - matchers:
    - alertname =~ "KialiHub.*"
    receiver: 'kiali-slack'

receivers:
- name: 'default'
- name: 'kiali-slack'
  slack_configs:
  - channel: '#alerts'
    send_resolved: true
Alertmanager posts a default Slack message with the alert status, name, and labels. To customize the message, add title, text, or blocks fields to slack_configs using Go templates — see the upstream Alertmanager Slack configuration docs.
Example: email
global:
  resolve_timeout: 5m
  smtp_smarthost: 'smtp.example.com:587'
  smtp_from: 'alertmanager@example.com'
  smtp_auth_username: 'alertmanager'
  smtp_auth_password: 'REPLACE_ME'

route:
  group_by: ['alertname', 'cluster']
  group_wait: 30s
  group_interval: 5m
  repeat_interval: 3h
  receiver: 'kiali-email'

receivers:
- name: 'kiali-email'
  email_configs:
  - to: 'oncall@example.com'
    send_resolved: true
Alertmanager uses default templates for the email subject and body. The subject includes the alert state, count, and alert name (e.g. [FIRING:2] KialiHubHealthFailure critical), and the body lists the full label set and annotations. To customize, add headers and text or html fields to email_configs — see the upstream Alertmanager email configuration docs.
Example: generic webhook
Sends a JSON POST to any HTTP endpoint — useful for integrating with custom tooling, chat bots, or incident management systems that accept webhooks:
route:
  group_by: ['alertname', 'cluster']
  receiver: 'kiali-webhook'

receivers:
- name: 'kiali-webhook'
  webhook_configs:
  - url: 'https://example.com/alerts/webhook'
    send_resolved: true
Alertmanager POSTs a JSON payload containing the alert status, labels, annotations, and timing information. The payload format is documented in the upstream Alertmanager webhook configuration docs.
You can combine multiple receivers (e.g. Slack + email), add routes that match on severity or alertname, and more — see Configuring Alertmanager for external notification systems in the Red Hat ACM docs and the upstream Alertmanager configuration docs.
Cleanup
Remove the resources this guide created. Re-export ${KIALI_NS} and ${KIALI_CR_NS} if you are in a new shell.
On each cluster where you completed Phases 1–5:
# Phase 5 demo: remove fault injection and restore health_config
oc --context=ossm-kiali-spoke delete virtualservice kiali-health-alert-demo \
  -n bookinfo --ignore-not-found

BACKUP=$(cat /tmp/kiali-health-config-backup.json 2>/dev/null)
if [ -n "${BACKUP}" ] && [ "${BACKUP}" != "{}" ]; then
  oc --context=ossm-kiali-spoke patch kiali kiali -n "${KIALI_CR_NS}" --type=merge \
    -p "{\"spec\":{\"health_config\":${BACKUP}}}"
else
  oc --context=ossm-kiali-spoke patch kiali kiali -n "${KIALI_CR_NS}" --type=json \
    -p='[{"op": "remove", "path": "/spec/health_config"}]' 2>/dev/null || true
fi

# Phase 5 demo: restore production "for" on KialiHealthFailure
oc --context=ossm-kiali-spoke get prometheusrule kiali-health-status -n "${KIALI_NS}" -o json 2>/dev/null \
  | jq 'del(.status)
        | (.spec.groups[] | select(.name == "kiali.health.alerts").rules[]
           | select(.alert == "KialiHealthFailure").for) = "5m"' \
  | oc --context=ossm-kiali-spoke apply -f - 2>/dev/null || true

# PrometheusRules (baseline from Phase 4 + optional custom rules from Phase 5)
oc --context=ossm-kiali-spoke delete prometheusrule \
  kiali-health-status \
  kiali-health-status-bookinfo \
  kiali-health-status-not-ready \
  -n "${KIALI_NS}" --ignore-not-found

# ServiceMonitor from Phase 3
oc --context=ossm-kiali-spoke delete servicemonitor kiali \
  -n "${KIALI_NS}" --ignore-not-found

# Turn off health-status metric export (leave other observability settings alone)
oc --context=ossm-kiali-spoke patch kiali kiali -n "${KIALI_CR_NS}" --type=merge -p '
spec:
  server:
    observability:
      metrics:
        health_status:
          enabled: false
'

oc --context=ossm-kiali-spoke wait kiali kiali \
  -n "${KIALI_CR_NS}" \
  --for=condition=Successful \
  --timeout=300s
Do not delete kiali-cabundle-openshift — the Kiali operator or Helm chart owns that ConfigMap.
This guide may have enabled User Workload Monitoring via cluster-monitoring-config. Leave that ConfigMap in place if you still need UWM (for example after the hub/spoke guide). Remove it only if you enabled UWM solely for this guide and want monitoring for user projects turned off:
# Optional — disables UWM cluster-wide
# oc --context=ossm-kiali-spoke delete configmap cluster-monitoring-config \
#   -n openshift-monitoring --ignore-not-found
Multi-cluster (Phase 6)
If you added the MCOA federation resources for kiali_health_status, remove the placement references first (while MCOA and ACM are still running), then delete the source resources:
# Remove placement references
ADDON_JSON=$(oc --context=ossm-kiali-hub get clustermanagementaddon \
  multicluster-observability-addon -o json 2>/dev/null || true)
if [ -n "${ADDON_JSON}" ]; then
  remove_mcoa_ref() {
    local group=$1 resource=$2 name=$3
    local patch
    patch=$(echo "${ADDON_JSON}" | jq -c \
      --arg g "${group}" --arg r "${resource}" --arg n "${name}" \
      --arg ns "open-cluster-management-observability" \
      '[(.spec.installStrategy.placements // []) | to_entries[] as $p |
        ($p.value.configs // []) | to_entries[] |
        select(.value.group == $g and .value.resource == $r and
               .value.name == $n and .value.namespace == $ns) |
        {op:"remove",
         path:("/spec/installStrategy/placements/"+($p.key|tostring)+"/configs/"+(.key|tostring))}]
      | sort_by(.path) | reverse')
    [ "${patch}" = "[]" ] || \
      oc --context=ossm-kiali-hub patch clustermanagementaddon \
        multicluster-observability-addon --type=json -p="${patch}"
    ADDON_JSON=$(oc --context=ossm-kiali-hub get clustermanagementaddon \
      multicluster-observability-addon -o json 2>/dev/null || echo "${ADDON_JSON}")
  }
  remove_mcoa_ref monitoring.rhobs scrapeconfigs kiali-istio-federation
  remove_mcoa_ref monitoring.coreos.com prometheusrules kiali-istio-aggregation
fi

# Delete the hub-side source resources
oc --context=ossm-kiali-hub delete scrapeconfig kiali-istio-federation \
  -n open-cluster-management-observability --ignore-not-found
oc --context=ossm-kiali-hub delete prometheusrule kiali-istio-aggregation \
  -n open-cluster-management-observability --ignore-not-found
If you added hub Thanos Ruler rules, delete the ConfigMap if this guide created it and you have no other custom hub rules:
oc --context=ossm-kiali-hub -n open-cluster-management-observability \
  delete configmap thanos-ruler-custom-rules --ignore-not-found
If thanos-ruler-custom-rules has other groups you want to keep, edit the ConfigMap and remove only the kiali.health.hub.alerts group from custom_rules.yaml, leaving other groups intact:
oc --context=ossm-kiali-hub -n open-cluster-management-observability \
  edit configmap thanos-ruler-custom-rules
If you changed ACM Alertmanager routing in Routing alerts to Slack, email, or webhooks, restore from your backup (/tmp/alertmanager.yaml.bak) with the same create secret … | replace command, or leave the receivers in place if you still want third-party notifications.
Network Health (Phase 7)
If you completed Phase 7, remove NetObserv first, then leave (or restore) the Phase 4 PrometheusRule without NetObserv annotations. Loki was not installed in this guide’s Loki-less path.
# Delete FlowCollector first — the operator must still be running to finalize its managed resources
oc --context=ossm-kiali-spoke delete flowcollector cluster --ignore-not-found

# Wait for the FlowCollector to be fully removed
oc --context=ossm-kiali-spoke wait flowcollector/cluster --for=delete --timeout=120s 2>/dev/null || true

# Delete the netobserv workload namespace (created by the FlowCollector, not removed automatically)
oc --context=ossm-kiali-spoke delete namespace netobserv --ignore-not-found

# Now remove the operator — all CRs are gone so the operator can be safely uninstalled
oc --context=ossm-kiali-spoke delete subscription netobserv-operator \
  -n openshift-netobserv-operator --ignore-not-found

# Delete pending install plans before removing CSVs — otherwise OLM may recreate CSVs from in-flight plans
oc --context=ossm-kiali-spoke delete installplan --all \
  -n openshift-netobserv-operator --ignore-not-found

# Remove ALL CSVs — delete the CSV in the operator namespace only; OLM cascades deletion to all copied namespaces automatically
oc --context=ossm-kiali-spoke delete csv -n openshift-netobserv-operator --all --ignore-not-found

# Remove OperatorGroup and operator namespace
oc --context=ossm-kiali-spoke delete operatorgroup openshift-netobserv-operator \
  -n openshift-netobserv-operator --ignore-not-found
oc --context=ossm-kiali-spoke delete namespace openshift-netobserv-operator --ignore-not-found

# Remove orphaned ConsolePlugin
oc --context=ossm-kiali-spoke delete consoleplugin netobserv-plugin-static --ignore-not-found

# Remove orphaned ClusterRoles
oc --context=ossm-kiali-spoke get clusterrole -o name | grep netobserv | \
  xargs -r oc --context=ossm-kiali-spoke delete --ignore-not-found

# Remove ALL CRDs — you must remove every CRD installed by the Network Observability Operator or reinstallation will conflict
for suffix in flows.netobserv.io; do
  CRDS=$(oc --context=ossm-kiali-spoke get crd \
    --no-headers -o custom-columns=NAME:.metadata.name 2>/dev/null \
    | grep "\.${suffix}$")
  [ -n "${CRDS}" ] && echo "${CRDS}" | xargs oc --context=ossm-kiali-spoke delete crd --ignore-not-found
done
If you still want Phase 4 alerts under Observe > Alerting without Network Health metadata, re-apply the Phase 4 PrometheusRule from §4.1. If you are removing all health alerts, the Phases 1–5 cleanup above already deletes kiali-health-status.