Dashboards and Tracing
This guide extends the result of the Multi-Primary Mesh guide by adding two observability tools that operate across both spoke clusters. Both tools are delivered through the Red Hat Cluster Observability Operator (COO), which manages their deployment and integrates them into the OpenShift console:
- Phase 1 — Perses: Deploys a Perses metrics dashboard server and OpenShift console plugin via COO. The datasource is pointed at hub Thanos so it queries aggregated metrics from both spokes, giving a true multi-cluster view.
- Phase 2 — Tempo: Deploys a distributed tracing server and OpenShift console plugin via COO. A central Tempo instance on
spokecollects traces from both clusters via OpenTelemetry collectors. Kiali links to the console tracing UI and can filter traces by cluster. Neither ACM Observability nor any other component already in place aggregates traces — that requires an explicit OTEL pipeline, which this guide sets up.
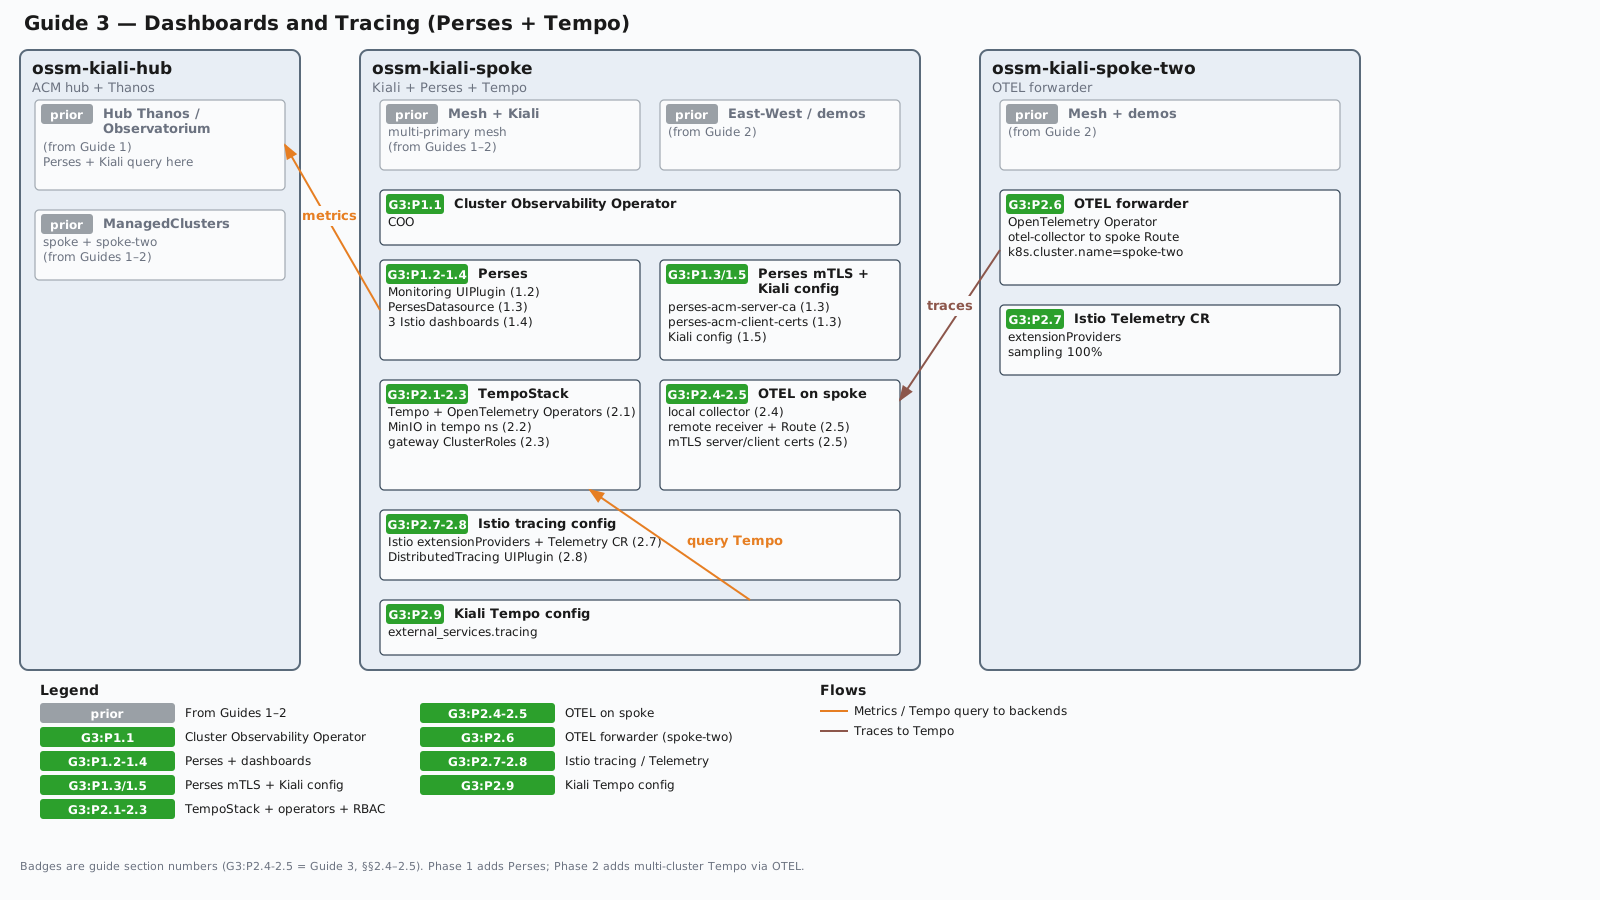
The diagram below shows the environment after this guide completes. Components from Guides 1–2 are marked prior; badges such as G3:P2.4-2.5 mark which guide section(s) add each piece (Guide 3, §§2.4–2.5). Click the diagram to open a full-size SVG in a new tab.
Prerequisites
The Multi-Primary Mesh guide must be complete:
- OpenShift 4.19+ on all clusters used in the series
- ACM hub with both
spokeandspoke-twomanaged clusters - OSSM 3 running on both spokes with East-West gateways
- Kiali running on
spoke - ACM Observability (Thanos) running on the hub
- Demo apps (
ambient-demo,bookinfo) deployed on both spokes
Environment Setup
These variables extend the multi-primary environment. Re-export all variables from that guide first, then add:
# Namespace where the TempoStack and SeaweedFS are deployed
export TEMPO_NAMESPACE="tempo"

# Development credentials for the in-cluster SeaweedFS S3 endpoint
export SEAWEEDFS_ACCESS_KEY="seaweedfs"
export SEAWEEDFS_SECRET_KEY="seaweedfs123"

# Name of the TempoStack CR — becomes part of service names
# (e.g. tempo-${TEMPO_STACK_NAME}-gateway). Use one stack per independent
# Tempo deployment; if you run multiple meshes, each mesh can share this
# stack by using a separate tenant.
export TEMPO_STACK_NAME="istio"

# Tempo tenant name — a logical partition within the TempoStack that
# isolates one mesh's traces from another's. Matches MESH_ID from the
# hub/spoke guide so the tenant name reflects the mesh it belongs to.
# If you add a second mesh later, create a second tenant rather than
# a second TempoStack.
export TEMPO_TENANT="mesh1"
Phase 1: Perses — Multi-Cluster Metrics Dashboards
Perses is a metrics dashboard platform. On OpenShift it is managed by the Cluster Observability Operator (COO), which provides native CRDs (Perses, PersesDatasource, PersesDashboard) and integrates with the OpenShift console as a UI plugin. Kiali links to Perses dashboards from its workload and service metrics pages.
The key multi-cluster aspect: Perses is configured with a datasource pointing at hub Thanos (the ACM Observatorium endpoint) rather than a local Prometheus. This gives Perses visibility into metrics from both spoke clusters without any additional aggregation work.
1.1 Install or Verify the Cluster Observability Operator
Check whether a full COO Subscription is already installed. Do not use the ScrapeConfig CRD for this check because MCOA also installs that API:
COO_SUB=$(oc --context=ossm-kiali-spoke get subscriptions.operators.coreos.com -A -o json 2>/dev/null | \
  jq -r '[.items[] | select(.spec.name == "cluster-observability-operator")][0] |
    select(. != null) | "\(.metadata.namespace)/\(.metadata.name)"')
[ -n "${COO_SUB}" ] && echo "COO Subscription found: ${COO_SUB}" || \
  echo "COO Subscription is not found"
If COO is not yet installed, install it:
oc --context=ossm-kiali-spoke apply -f - <<'EOF'
apiVersion: v1
kind: Namespace
metadata:
  labels:
    openshift.io/cluster-monitoring: "true"
  name: openshift-cluster-observability-operator
---
apiVersion: operators.coreos.com/v1
kind: OperatorGroup
metadata:
  name: cluster-observability-operator
  namespace: openshift-cluster-observability-operator
spec: {}
---
apiVersion: operators.coreos.com/v1alpha1
kind: Subscription
metadata:
  name: cluster-observability-operator
  namespace: openshift-cluster-observability-operator
spec:
  channel: stable
  installPlanApproval: Automatic
  name: cluster-observability-operator
  source: redhat-operators
  sourceNamespace: openshift-marketplace
EOF
Wait for COO and its CRDs to be ready (skip if COO was already installed):
until oc --context=ossm-kiali-spoke get crd perses.perses.dev &>/dev/null; do
  echo "Waiting for Perses CRDs..."
  sleep 10
done
echo "COO CRDs ready"

until oc --context=ossm-kiali-spoke get pods \
  -l app.kubernetes.io/name=perses-operator \
  -n openshift-cluster-observability-operator \
  --no-headers 2>/dev/null | grep -q .; do sleep 5; done
oc --context=ossm-kiali-spoke wait pod \
  --for=condition=Ready \
  -l app.kubernetes.io/name=perses-operator \
  -n openshift-cluster-observability-operator \
  --timeout=300s
echo "COO Perses operator ready"
1.2 Create the Monitoring UIPlugin to Deploy the Perses Server
The Perses server is deployed by a UIPlugin CR with spec.monitoring.perses.enabled: true. This also adds the Observe > Dashboards (Perses) menu to the OpenShift console. The Perses CR that COO creates under the covers is a configuration holder — the UIPlugin is what triggers the actual Perses server pod:
oc --context=ossm-kiali-spoke apply -f - <<'EOF'
apiVersion: observability.openshift.io/v1alpha1
kind: UIPlugin
metadata:
  name: monitoring
spec:
  type: Monitoring
  monitoring:
    perses:
      enabled: true
EOF
Wait for the Perses server pod. The COO creates it as a StatefulSet in the openshift-cluster-observability-operator namespace:
until oc --context=ossm-kiali-spoke get pods \
  -l app.kubernetes.io/name=perses \
  -n openshift-cluster-observability-operator \
  --no-headers 2>/dev/null | grep -q .; do
  echo "Waiting for Perses pod..."
  sleep 5
done
oc --context=ossm-kiali-spoke wait pod \
  --for=condition=Ready \
  -l app.kubernetes.io/name=perses \
  -n openshift-cluster-observability-operator \
  --timeout=300s
echo "Perses ready"
1.3 Create the Hub Thanos Datasource
The Observatorium API on the hub requires mutual TLS (mTLS): Perses must verify the server’s certificate (using a custom ACM CA, not the OCP service CA) and also present a client certificate to authenticate. The Perses server handles this through two mechanisms:
- Server CA — mounted into
/etc/ssl/certs/so Go’s system cert pool trusts the hub Thanos route’s certificate - Client cert — the
PersesDatasourceCR’sspec.client.tls.userCertfield tells the Perses operator which K8s Secret holds the client cert. The operator reads it and creates a Perses-internal secret. Thespec.config.plugin.spec.proxy.spec.secretfield then wires that internal secret to the HTTP proxy transport, completing the mTLS handshake
Get the Observatorium URL:
export OBSERVATORIUM_URL=$(oc --context=ossm-kiali-hub get route observatorium-api \
  -n open-cluster-management-observability \
  -o jsonpath='https://{.spec.host}/api/metrics/v1/default')
echo "Observatorium URL: ${OBSERVATORIUM_URL}"
Two credentials need to be prepared before creating the datasource:
- Server CA — the hub Observatorium API route’s TLS certificate is signed by a custom ACM CA (
observability-server-ca-certificate), not the standard OCP service CA. Extract it from the hub and store it in a ConfigMap inopenshift-cluster-observability-operatoronspokeso it can be mounted into the Perses pod. - Client cert — Perses will use the same mTLS client certificate that Kiali uses to authenticate to hub Thanos. That certificate is the
acm-observability-certssecret inistio-systemonspoke. Copy it toopenshift-cluster-observability-operatorunder a new name so it can be mounted into the Perses pod as a volume (the Perses pod runs inopenshift-cluster-observability-operatorand can only mount secrets from its own namespace).
# Server CA — extracted from the hub, stored as a ConfigMap on spoke
oc --context=ossm-kiali-hub get secret observability-server-ca-certs \
  -n open-cluster-management-observability \
  -o jsonpath='{.data.ca\.crt}' | base64 -d > /tmp/obs-server-ca.crt

oc --context=ossm-kiali-spoke create configmap perses-acm-server-ca \
  -n openshift-cluster-observability-operator \
  --from-file=ca.crt=/tmp/obs-server-ca.crt \
  --dry-run=client -o yaml | oc --context=ossm-kiali-spoke apply -f -
rm -f /tmp/obs-server-ca.crt

# Client cert — copied from istio-system to openshift-cluster-observability-operator
oc --context=ossm-kiali-spoke get secret acm-observability-certs \
  -n istio-system -o json | \
  jq 'del(.metadata.namespace, .metadata.resourceVersion, .metadata.uid, .metadata.creationTimestamp, .metadata.ownerReferences) | .metadata.namespace = "openshift-cluster-observability-operator" | .metadata.name = "perses-acm-client-certs"' | \
  oc --context=ossm-kiali-spoke apply -f -
Mount the CA ConfigMap into /etc/ssl/certs/ in the Perses pod using the Perses CR’s spec.volumes and spec.volumeMounts. Placing it there adds it to Go’s system certificate pool, so the Perses server trusts the hub Thanos route’s TLS certificate for all outgoing connections:
oc --context=ossm-kiali-spoke patch perses perses \
  -n openshift-cluster-observability-operator --type=merge -p '{
  "spec": {
    "volumes": [
      {
        "name": "acm-server-ca",
        "configMap": {"name": "perses-acm-server-ca"}
      }
    ],
    "volumeMounts": [
      {
        "name": "acm-server-ca",
        "mountPath": "/etc/ssl/certs/acm-thanos-ca.crt",
        "subPath": "ca.crt",
        "readOnly": true
      }
    ]
  }
}'

oc --context=ossm-kiali-spoke wait pod \
  --for=condition=Ready \
  -l app.kubernetes.io/name=perses \
  -n openshift-cluster-observability-operator \
  --timeout=120s
Create the perses namespace if it does not yet exist.
This is where PersesDatasource and PersesDashboard CRs live — the Perses Operator maps this namespace to a Perses project, making dashboards available in the console under the perses project:
oc --context=ossm-kiali-spoke create namespace perses
Create the PersesDatasource CR. The client.tls.userCert field references the perses-acm-client-certs secret created above. The Perses operator reads that K8s Secret and creates a Perses-internal secret automatically named <datasource-name>-secret — in this case acm-thanos-secret. The proxy.spec.secret: acm-thanos-secret field tells the Perses server to use that internal secret (with the client cert and key) when building the mTLS transport for this datasource:
oc --context=ossm-kiali-spoke apply -f - <<EOF
apiVersion: perses.dev/v1alpha2
kind: PersesDatasource
metadata:
  name: acm-thanos
  namespace: perses
spec:
  config:
    display:
      name: "ACM Hub Thanos"
    default: false
    plugin:
      kind: PrometheusDatasource
      spec:
        proxy:
          kind: HTTPProxy
          spec:
            url: "${OBSERVATORIUM_URL}"
            secret: acm-thanos-secret
  client:
    tls:
      enable: true
      caCert:
        type: file
        certPath: /etc/ssl/certs/acm-thanos-ca.crt
      userCert:
        type: secret
        name: perses-acm-client-certs
        namespace: openshift-cluster-observability-operator
        certPath: tls.crt
        privateKeyPath: tls.key
EOF
Verify the datasource was accepted:
oc --context=ossm-kiali-spoke get persesdatasource acm-thanos \
  -n perses \
  -o jsonpath='{.status.conditions[?(@.type=="Available")].message}{"\n"}'
# Expected: Datasource (acm-thanos) created successfully
1.4 Create Istio Dashboards
Create three Istio dashboards, each focusing on a different layer of observability:
- Istio Mesh Overview — cluster-wide HTTP request rates, 5xx error rates, and ambient L4 TCP throughput. Use this to get a top-down view of overall mesh health across both spoke clusters.
- Istio Workload Dashboard — per-workload inbound and outbound HTTP request rates, p99 latency, and success rate. Accepts
$workloadand$namespacevariables to filter to a specific workload. - Istio Ztunnel Dashboard — ambient-mode L4 TCP connection counts and byte throughput, showing traffic handled by ztunnel across the mesh.
The PersesDashboard resources below contain the full Prometheus queries for each panel. You can modify the queries, add panels, or create entirely new dashboards to suit your environment — these are a starting point. All panels use the acm-thanos datasource so data from both spoke clusters is included.
Istio Mesh Overview — cluster-wide HTTP and TCP traffic rates:
oc --context=ossm-kiali-spoke apply -f - <<'EOF'
apiVersion: perses.dev/v1alpha2
kind: PersesDashboard
metadata:
  name: istio-mesh-overview
  namespace: perses
spec:
  config:
    display:
      name: "Istio Mesh Overview"
    duration: 30m
    layouts:
    - kind: Grid
      spec:
        display:
          title: "HTTP Traffic"
        items:
        - content:
            $ref: '#/spec/panels/request_rate'
          height: 8
          width: 12
          x: 0
          "y": 0
        - content:
            $ref: '#/spec/panels/error_rate'
          height: 8
          width: 12
          x: 12
          "y": 0
    - kind: Grid
      spec:
        display:
          title: "TCP Traffic (Ambient / Ztunnel)"
        items:
        - content:
            $ref: '#/spec/panels/tcp_sent'
          height: 8
          width: 12
          x: 0
          "y": 0
        - content:
            $ref: '#/spec/panels/tcp_received'
          height: 8
          width: 12
          x: 12
          "y": 0
    panels:
      request_rate:
        kind: Panel
        spec:
          display:
            name: "Request Rate (rps)"
          plugin:
            kind: TimeSeriesChart
            spec:
              legend:
                mode: list
                position: bottom
          queries:
          - kind: TimeSeriesQuery
            spec:
              plugin:
                kind: PrometheusTimeSeriesQuery
                spec:
                  datasource:
                    kind: PrometheusDatasource
                    name: acm-thanos
                  query: sum(rate(istio_requests_total{reporter=~"destination|waypoint"}[10m])) by (destination_service_name)
      error_rate:
        kind: Panel
        spec:
          display:
            name: "5xx Error Rate"
          plugin:
            kind: TimeSeriesChart
            spec:
              legend:
                mode: list
                position: bottom
          queries:
          - kind: TimeSeriesQuery
            spec:
              plugin:
                kind: PrometheusTimeSeriesQuery
                spec:
                  datasource:
                    kind: PrometheusDatasource
                    name: acm-thanos
                  query: sum(rate(istio_requests_total{reporter=~"destination|waypoint",response_code=~"5.*"}[10m])) by (destination_service_name)
      tcp_sent:
        kind: Panel
        spec:
          display:
            name: "TCP Bytes Sent"
          plugin:
            kind: TimeSeriesChart
            spec:
              legend:
                mode: list
                position: bottom
          queries:
          - kind: TimeSeriesQuery
            spec:
              plugin:
                kind: PrometheusTimeSeriesQuery
                spec:
                  datasource:
                    kind: PrometheusDatasource
                    name: acm-thanos
                  query: sum(rate(istio_tcp_sent_bytes_total[10m])) by (destination_workload)
      tcp_received:
        kind: Panel
        spec:
          display:
            name: "TCP Bytes Received"
          plugin:
            kind: TimeSeriesChart
            spec:
              legend:
                mode: list
                position: bottom
          queries:
          - kind: TimeSeriesQuery
            spec:
              plugin:
                kind: PrometheusTimeSeriesQuery
                spec:
                  datasource:
                    kind: PrometheusDatasource
                    name: acm-thanos
                  query: sum(rate(istio_tcp_received_bytes_total[10m])) by (destination_workload)
EOF
Istio Workload Dashboard — per-workload inbound/outbound HTTP rates and latency, with $workload and $namespace variables:
oc --context=ossm-kiali-spoke apply -f - <<'EOF'
apiVersion: perses.dev/v1alpha2
kind: PersesDashboard
metadata:
  name: istio-workload-dashboard
  namespace: perses
spec:
  config:
    display:
      name: "Istio Workload Dashboard"
    duration: 30m
    variables:
    - kind: TextVariable
      spec:
        name: workload
        display:
          name: Workload
        value: ""
    - kind: TextVariable
      spec:
        name: namespace
        display:
          name: Namespace
        value: ""
    layouts:
    - kind: Grid
      spec:
        display:
          title: "Inbound HTTP"
        items:
        - content:
            $ref: '#/spec/panels/inbound_rps'
          height: 8
          width: 12
          x: 0
          "y": 0
        - content:
            $ref: '#/spec/panels/inbound_latency'
          height: 8
          width: 12
          x: 12
          "y": 0
    - kind: Grid
      spec:
        display:
          title: "Outbound HTTP"
        items:
        - content:
            $ref: '#/spec/panels/outbound_rps'
          height: 8
          width: 12
          x: 0
          "y": 0
        - content:
            $ref: '#/spec/panels/success_rate'
          height: 8
          width: 12
          x: 12
          "y": 0
    panels:
      inbound_rps:
        kind: Panel
        spec:
          display:
            name: "Inbound Request Rate"
          plugin:
            kind: TimeSeriesChart
            spec:
              legend:
                mode: list
                position: bottom
          queries:
          - kind: TimeSeriesQuery
            spec:
              plugin:
                kind: PrometheusTimeSeriesQuery
                spec:
                  datasource:
                    kind: PrometheusDatasource
                    name: acm-thanos
                  query: sum(rate(istio_requests_total{reporter=~"destination|waypoint",destination_workload="$workload",destination_workload_namespace=~"$namespace"}[10m])) by (source_app)
      inbound_latency:
        kind: Panel
        spec:
          display:
            name: "Inbound Request Latency (p99)"
          plugin:
            kind: TimeSeriesChart
            spec:
              legend:
                mode: list
                position: bottom
          queries:
          - kind: TimeSeriesQuery
            spec:
              plugin:
                kind: PrometheusTimeSeriesQuery
                spec:
                  datasource:
                    kind: PrometheusDatasource
                    name: acm-thanos
                  query: histogram_quantile(0.99, sum(rate(istio_request_duration_milliseconds_bucket{reporter=~"destination|waypoint",destination_workload="$workload",destination_workload_namespace=~"$namespace"}[10m])) by (le))
      outbound_rps:
        kind: Panel
        spec:
          display:
            name: "Outbound Request Rate"
          plugin:
            kind: TimeSeriesChart
            spec:
              legend:
                mode: list
                position: bottom
          queries:
          - kind: TimeSeriesQuery
            spec:
              plugin:
                kind: PrometheusTimeSeriesQuery
                spec:
                  datasource:
                    kind: PrometheusDatasource
                    name: acm-thanos
                  query: sum(rate(istio_requests_total{reporter=~"source|waypoint",source_workload="$workload",source_workload_namespace=~"$namespace"}[10m])) by (destination_service_name)
      success_rate:
        kind: Panel
        spec:
          display:
            name: "Success Rate (non-5xx)"
          plugin:
            kind: TimeSeriesChart
            spec:
              legend:
                mode: list
                position: bottom
          queries:
          - kind: TimeSeriesQuery
            spec:
              plugin:
                kind: PrometheusTimeSeriesQuery
                spec:
                  datasource:
                    kind: PrometheusDatasource
                    name: acm-thanos
                  query: sum(rate(istio_requests_total{reporter=~"destination|waypoint",destination_workload="$workload",destination_workload_namespace=~"$namespace",response_code!~"5.*"}[10m])) / sum(rate(istio_requests_total{reporter=~"destination|waypoint",destination_workload="$workload",destination_workload_namespace=~"$namespace"}[10m]))
EOF
Istio Ztunnel Dashboard — ambient L4 TCP connection and throughput metrics:
oc --context=ossm-kiali-spoke apply -f - <<'EOF'
apiVersion: perses.dev/v1alpha2
kind: PersesDashboard
metadata:
  name: istio-ztunnel-dashboard
  namespace: perses
spec:
  config:
    display:
      name: "Istio Ztunnel Dashboard"
    duration: 30m
    layouts:
    - kind: Grid
      spec:
        display:
          title: "Ambient L4 Traffic"
        items:
        - content:
            $ref: '#/spec/panels/tcp_connections_opened'
          height: 8
          width: 12
          x: 0
          "y": 0
        - content:
            $ref: '#/spec/panels/tcp_bytes'
          height: 8
          width: 12
          x: 12
          "y": 0
    panels:
      tcp_connections_opened:
        kind: Panel
        spec:
          display:
            name: "TCP Connections Opened"
          plugin:
            kind: TimeSeriesChart
            spec:
              legend:
                mode: list
                position: bottom
          queries:
          - kind: TimeSeriesQuery
            spec:
              plugin:
                kind: PrometheusTimeSeriesQuery
                spec:
                  datasource:
                    kind: PrometheusDatasource
                    name: acm-thanos
                  query: sum(rate(istio_tcp_connections_opened_total[10m])) by (destination_workload)
      tcp_bytes:
        kind: Panel
        spec:
          display:
            name: "TCP Throughput (bytes/s)"
          plugin:
            kind: TimeSeriesChart
            spec:
              legend:
                mode: list
                position: bottom
          queries:
          - kind: TimeSeriesQuery
            spec:
              plugin:
                kind: PrometheusTimeSeriesQuery
                spec:
                  datasource:
                    kind: PrometheusDatasource
                    name: acm-thanos
                  query: sum(rate(istio_tcp_sent_bytes_total[10m]) + rate(istio_tcp_received_bytes_total[10m])) by (destination_workload)
EOF
Confirm all three dashboards are registered:
oc --context=ossm-kiali-spoke get persesdashboard -n perses | grep istio
# Expected: istio-mesh-overview, istio-workload, istio-ztunnel
1.5 Configure Kiali for Perses
Get the OpenShift console URL — this is where the COO Perses plugin lives:
CONSOLE_URL=$(oc --context=ossm-kiali-spoke get route console \
  -n openshift-console \
  -o jsonpath='https://{.spec.host}')
echo "Console URL: ${CONSOLE_URL}"
Patch the Kiali CR on spoke. Key settings:
url_format: "openshift"— Kiali builds dashboard links pointing to the OpenShift console Perses plugin. In this modeinternal_urlmust not be set — COO Perses uses OpenShift OAuth, so Kiali cannot authenticate to its API. Withoutinternal_url, Kiali skips dashboard validation and generates the links unconditionallyhealth_check_url— points at the in-cluster Perses/api/v1/healthendpoint so Kiali can verify reachability. This endpoint does not require authentication. Without it, Kiali’s cluster status shows Perses as “Unreachable” because the health check falls back toexternal_url(the OCP console), which is not a Perses APIproject— the Perses project name, which COO sets to the Kubernetes namespace where the dashboards live (perses)variables— maps Kiali’s semantic names to the exact Perses variable names defined in the dashboards created in the previous step.
oc --context=ossm-kiali-spoke patch kiali kiali -n istio-system --type=merge -p "{
  \"spec\": {
    \"external_services\": {
      \"perses\": {
        \"enabled\": true,
        \"url_format\": \"openshift\",
        \"external_url\": \"${CONSOLE_URL}\",
        \"health_check_url\": \"https://perses.openshift-cluster-observability-operator.svc.cluster.local:8080/api/v1/health\",
        \"project\": \"perses\",
        \"dashboards\": [
          {\"name\": \"Istio Mesh Overview\"},
          {\"name\": \"Istio Workload Dashboard\",
           \"variables\": {
             \"namespace\": \"namespace\",
             \"workload\": \"workload\"}},
          {\"name\": \"Istio Ztunnel Dashboard\"}
        ]
      }
    }
  }
}"

oc --context=ossm-kiali-spoke wait kiali kiali \
  -n istio-system \
  --for=condition=Successful \
  --timeout=300s

oc --context=ossm-kiali-spoke rollout status deployment/kiali \
  -n istio-system --timeout=120s
1.6 Verify Perses
# Confirm Perses pod is running
oc --context=ossm-kiali-spoke get pods \
  -l app.kubernetes.io/name=perses \
  -n openshift-cluster-observability-operator

# Check the Istio dashboards are registered
oc --context=ossm-kiali-spoke get persesdashboard -n perses | grep istio

# Confirm Kiali's Perses config is applied
oc --context=ossm-kiali-spoke get kiali kiali -n istio-system \
  -o jsonpath='{.spec.external_services.perses.enabled}{"\n"}'
# Expected: true
The Perses links appear in specific Kiali pages depending on the dashboard:
- Istio Workload Dashboard — navigate to Workloads, select any workload (e.g.
productpage-v1inbookinfo), and open the Inbound Metrics or Outbound Metrics tab. The View in Perses link appears in the metrics toolbar. - Istio Ztunnel Dashboard — navigate to Workloads, select the
ztunnelworkload in theztunnelnamespace, and open its Metrics tab found in the ZTunnel subtab. - Istio Mesh Overview — this dashboard is not linked automatically from any Kiali page. Access it directly from the OpenShift console at Observe > Dashboards (Perses) and select it from the list.
Clicking a View in Perses link opens the OpenShift console Perses plugin on spoke. If you are not already logged in, the console will prompt for credentials.
Workload and Namespace fields for the Istio Workload Dashboard (e.g. productpage-v1 and bookinfo). When the bug is fixed, the link will open the correct dashboard with the workload already selected.
Phase 2: Tempo — Multi-Cluster Distributed Tracing
Tempo is a distributed tracing backend. The architecture deployed here:
- A central TempoStack runs on
spoke, backed by in-cluster SeaweedFS - A local OTEL collector on
spokereceives traces fromspoke’s Istio proxies and forwards them to Tempo - A remote OTEL collector on
spokereceives traces fromspoke-two’s OTEL collector over a passthrough mTLS Route - A remote forwarder on
spoke-tworeceives traces fromspoke-two’s Istio proxies and forwards them tospokevia the mTLS Route - Each cluster’s Istio is patched with an
extensionProviderand aTelemetryCR to send traces to the local OTEL collector
Kiali on spoke queries the single Tempo endpoint. Traces from both clusters land in the same Tempo tenant. Each OTEL collector stamps a k8s.cluster.name resource attribute on every span using its resource processor — spoke for the spoke collector and spoke-two for the spoke-two forwarder. This attribute is set at collector deploy time and can be used to filter traces by cluster in the Kiali tracing view.
2.1 Install Tempo and OpenTelemetry Operators
Install the Tempo Operator and OpenTelemetry Operator on spoke, and the OpenTelemetry Operator on spoke-two. Both operators go into openshift-operators — the same namespace used by OSSM and Kiali:
# Tempo Operator on spoke only
oc --context=ossm-kiali-spoke apply -f - <<'EOF'
apiVersion: operators.coreos.com/v1alpha1
kind: Subscription
metadata:
  name: tempo-product
  namespace: openshift-operators
spec:
  channel: stable
  installPlanApproval: Automatic
  name: tempo-product
  source: redhat-operators
  sourceNamespace: openshift-marketplace
EOF

# OpenTelemetry Operator on both clusters
for CTX in ossm-kiali-spoke ossm-kiali-spoke-two; do
  oc --context="${CTX}" apply -f - <<'EOF'
apiVersion: operators.coreos.com/v1alpha1
kind: Subscription
metadata:
  name: opentelemetry-product
  namespace: openshift-operators
spec:
  channel: stable
  installPlanApproval: Automatic
  name: opentelemetry-product
  source: redhat-operators
  sourceNamespace: openshift-marketplace
EOF
done
Wait for the CRDs to be established:
until oc --context=ossm-kiali-spoke get crd tempostacks.tempo.grafana.com &>/dev/null; do
  echo "Waiting for TempoStack CRD on spoke..."
  sleep 10
done
echo "Tempo CRD ready"

until oc --context=ossm-kiali-spoke get crd opentelemetrycollectors.opentelemetry.io &>/dev/null; do
  echo "Waiting for OpenTelemetryCollector CRD on spoke..."
  sleep 10
done
echo "OTel CRD ready on spoke"

until oc --context=ossm-kiali-spoke-two get crd opentelemetrycollectors.opentelemetry.io &>/dev/null; do
  echo "Waiting for OpenTelemetryCollector CRD on spoke-two..."
  sleep 10
done
echo "OTel CRD ready on spoke-two"
2.2 Deploy SeaweedFS and TempoStack on Spoke
Deploy SeaweedFS mini mode as a single-pod S3-compatible object store for Tempo, then create the TempoStack. The stack runs in multi-tenant OpenShift mode with tenant ${TEMPO_TENANT} for trace writes and reads.
oc --context=ossm-kiali-spoke create namespace "${TEMPO_NAMESPACE}" 2>/dev/null || true

# SeaweedFS deployment and PVC
oc --context=ossm-kiali-spoke apply -n "${TEMPO_NAMESPACE}" -f - <<EOF
apiVersion: v1
kind: PersistentVolumeClaim
metadata:
  name: seaweedfs-pv-claim
spec:
  accessModes:
  - ReadWriteOnce
  resources:
    requests:
      storage: 256Mi
---
apiVersion: apps/v1
kind: Deployment
metadata:
  name: seaweedfs
spec:
  selector:
    matchLabels:
      app: seaweedfs
  strategy:
    type: Recreate
  template:
    metadata:
      labels:
        app: seaweedfs
    spec:
      volumes:
      - name: storage
        persistentVolumeClaim:
          claimName: seaweedfs-pv-claim
      containers:
      - name: seaweedfs
        image: ghcr.io/chrislusf/seaweedfs:4.47
        args:
        - mini
        - -dir=/data
        - -admin.port=12646
        - -master.telemetry=false
        env:
        - name: AWS_ACCESS_KEY_ID
          value: "${SEAWEEDFS_ACCESS_KEY}"
        - name: AWS_SECRET_ACCESS_KEY
          value: "${SEAWEEDFS_SECRET_KEY}"
        - name: S3_BUCKET
          value: "tempo-data"
        ports:
        - containerPort: 8333
          name: s3
        volumeMounts:
        - name: storage
          mountPath: "/data"
        readinessProbe:
          tcpSocket:
            port: 8333
          initialDelaySeconds: 10
          periodSeconds: 5
        livenessProbe:
          tcpSocket:
            port: 8333
          initialDelaySeconds: 10
          periodSeconds: 5
---
apiVersion: v1
kind: Service
metadata:
  name: seaweedfs
spec:
  type: ClusterIP
  ports:
  - port: 8333
    targetPort: 8333
    protocol: TCP
    name: s3
  selector:
    app: seaweedfs
EOF

oc --context=ossm-kiali-spoke rollout status deployment/seaweedfs \
  -n "${TEMPO_NAMESPACE}" --timeout=120s
Create the SeaweedFS object storage secret and the TempoStack CR:
oc --context=ossm-kiali-spoke create secret generic tempostack-dev-seaweedfs \
  -n "${TEMPO_NAMESPACE}" \
  --from-literal=bucket="tempo-data" \
  --from-literal=endpoint="http://seaweedfs.${TEMPO_NAMESPACE}.svc.cluster.local:8333" \
  --from-literal=access_key_id="${SEAWEEDFS_ACCESS_KEY}" \
  --from-literal=access_key_secret="${SEAWEEDFS_SECRET_KEY}" \
  --dry-run=client -o yaml | oc --context=ossm-kiali-spoke apply -f -

oc --context=ossm-kiali-spoke apply -f - <<EOF
apiVersion: tempo.grafana.com/v1alpha1
kind: TempoStack
metadata:
  name: ${TEMPO_STACK_NAME}
  namespace: ${TEMPO_NAMESPACE}
spec:
  managementState: Managed
  storageSize: 1Gi
  storage:
    secret:
      type: s3
      name: tempostack-dev-seaweedfs
  tenants:
    mode: openshift
    authentication:
    - tenantName: ${TEMPO_TENANT}
      tenantId: a1b2c3d4-e5f6-7890-abcd-ef1234567890
  template:
    gateway:
      enabled: true
EOF

echo "Waiting for TempoStack gateway service..."
until oc --context=ossm-kiali-spoke get svc \
  "tempo-${TEMPO_STACK_NAME}-gateway" \
  -n "${TEMPO_NAMESPACE}" &>/dev/null; do sleep 5; done
echo "TempoStack ready"
2.3 RBAC for Tempo Gateway
Grant the OTEL collectors permission to write and read traces through the Tempo gateway:
REMOTE_COLLECTOR_NAME="otel-remote-${SPOKE_TWO_CLUSTER_NAME}"

# Write role — used by both the local and remote collectors
oc --context=ossm-kiali-spoke apply -f - <<EOF
apiVersion: rbac.authorization.k8s.io/v1
kind: ClusterRole
metadata:
  name: tempostack-traces-write
rules:
- apiGroups:
  - tempo.grafana.com
  resources:
  - ${TEMPO_TENANT}
  resourceNames:
  - traces
  verbs:
  - create
---
apiVersion: rbac.authorization.k8s.io/v1
kind: ClusterRoleBinding
metadata:
  name: tempostack-traces-write-collectors
roleRef:
  apiGroup: rbac.authorization.k8s.io
  kind: ClusterRole
  name: tempostack-traces-write
subjects:
- kind: ServiceAccount
  name: otel-collector
  namespace: istio-system
- kind: ServiceAccount
  name: ${REMOTE_COLLECTOR_NAME}-collector
  namespace: istio-system
EOF

# Read role — allows authenticated users (including Kiali) to query traces
oc --context=ossm-kiali-spoke apply -f - <<EOF
apiVersion: rbac.authorization.k8s.io/v1
kind: ClusterRole
metadata:
  name: tempostack-traces-reader-${TEMPO_TENANT}
rules:
- apiGroups:
  - tempo.grafana.com
  resources:
  - ${TEMPO_TENANT}
  resourceNames:
  - traces
  verbs:
  - get
---
apiVersion: rbac.authorization.k8s.io/v1
kind: ClusterRoleBinding
metadata:
  name: tempostack-traces-reader-${TEMPO_TENANT}
roleRef:
  apiGroup: rbac.authorization.k8s.io
  kind: ClusterRole
  name: tempostack-traces-reader-${TEMPO_TENANT}
subjects:
- kind: Group
  apiGroup: rbac.authorization.k8s.io
  name: system:authenticated
EOF
echo "RBAC applied"
2.4 Local OTEL Collector on Spoke
Deploy the local collector in istio-system. It receives OTLP traces from spoke’s Istio proxies and forwards them to the Tempo gateway using the pod’s service account token for authentication:
oc --context=ossm-kiali-spoke apply -f - <<EOF
apiVersion: opentelemetry.io/v1beta1
kind: OpenTelemetryCollector
metadata:
  name: otel
  namespace: istio-system
spec:
  mode: deployment
  replicas: 1
  config:
    receivers:
      otlp:
        protocols:
          grpc:
            endpoint: 0.0.0.0:4317
          http:
            endpoint: 0.0.0.0:4318
    extensions:
      bearertokenauth:
        filename: /var/run/secrets/kubernetes.io/serviceaccount/token
    processors:
      batch: {}
      resource:
        attributes:
        - key: k8s.cluster.name
          action: upsert
          value: ${SPOKE_CLUSTER_NAME}
    exporters:
      otlp_http/tempo:
        auth:
          authenticator: bearertokenauth
        endpoint: https://tempo-${TEMPO_STACK_NAME}-gateway.${TEMPO_NAMESPACE}.svc.cluster.local:8080/api/traces/v1/${TEMPO_TENANT}
        headers:
          X-Scope-OrgID: ${TEMPO_TENANT}
        tls:
          ca_file: /var/run/secrets/kubernetes.io/serviceaccount/service-ca.crt
    service:
      extensions:
      - bearertokenauth
      pipelines:
        traces:
          receivers:
          - otlp
          processors:
          - resource
          - batch
          exporters:
          - otlp_http/tempo
EOF

until oc --context=ossm-kiali-spoke get deployment otel-collector \
  -n istio-system &>/dev/null; do sleep 5; done

oc --context=ossm-kiali-spoke rollout status deployment/otel-collector \
  -n istio-system --timeout=300s
echo "Local OTEL collector ready"
2.5 Remote Receiver on Spoke with mTLS
Traces from spoke-two arrive at spoke via an mTLS-secured passthrough Route. This step creates the remote receiver collector, the Route, and the mTLS certificates (generated with openssl — no additional operators required).
First, create the remote receiver collector (it will stay in CrashLoopBackOff until the certs are ready — that is expected):
REMOTE_COLLECTOR_NAME="otel-remote-${SPOKE_TWO_CLUSTER_NAME}"
REMOTE_MTLS_CA_SECRET="${REMOTE_COLLECTOR_NAME}-ca"
REMOTE_MTLS_SERVER_SECRET="${REMOTE_COLLECTOR_NAME}-server-tls"
REMOTE_MTLS_CLIENT_SECRET="${REMOTE_COLLECTOR_NAME}-client-tls"
REMOTE_MTLS_CLIENT_BUNDLE="${REMOTE_COLLECTOR_NAME}-client-bundle"

oc --context=ossm-kiali-spoke apply -f - <<EOF
apiVersion: opentelemetry.io/v1beta1
kind: OpenTelemetryCollector
metadata:
  name: ${REMOTE_COLLECTOR_NAME}
  namespace: istio-system
spec:
  mode: deployment
  replicas: 1
  volumeMounts:
  - name: server-certs
    mountPath: /etc/otel/server
    readOnly: true
  - name: ca-cert
    mountPath: /etc/otel/ca
    readOnly: true
  volumes:
  - name: server-certs
    secret:
      secretName: ${REMOTE_MTLS_SERVER_SECRET}
  - name: ca-cert
    secret:
      secretName: ${REMOTE_MTLS_CA_SECRET}
  config:
    receivers:
      otlp:
        protocols:
          http:
            endpoint: 0.0.0.0:4318
            tls:
              cert_file: /etc/otel/server/tls.crt
              key_file: /etc/otel/server/tls.key
              client_ca_file: /etc/otel/ca/tls.crt
    processors:
      batch: {}
      resource:
        attributes:
        - key: receiving.cluster
          action: upsert
          value: ${SPOKE_CLUSTER_NAME}
        - key: source.cluster
          action: upsert
          value: ${SPOKE_TWO_CLUSTER_NAME}
    extensions:
      bearertokenauth:
        filename: /var/run/secrets/kubernetes.io/serviceaccount/token
    exporters:
      otlp_http/tempo:
        auth:
          authenticator: bearertokenauth
        endpoint: https://tempo-${TEMPO_STACK_NAME}-gateway.${TEMPO_NAMESPACE}.svc.cluster.local:8080/api/traces/v1/${TEMPO_TENANT}
        headers:
          X-Scope-OrgID: ${TEMPO_TENANT}
        tls:
          ca_file: /var/run/secrets/kubernetes.io/serviceaccount/service-ca.crt
    service:
      extensions:
      - bearertokenauth
      pipelines:
        traces:
          receivers:
          - otlp
          processors:
          - resource
          - batch
          exporters:
          - otlp_http/tempo
EOF
Create the passthrough Route that exposes the remote receiver:
oc --context=ossm-kiali-spoke apply -f - <<EOF
apiVersion: route.openshift.io/v1
kind: Route
metadata:
  name: ${REMOTE_COLLECTOR_NAME}
  namespace: istio-system
spec:
  to:
    kind: Service
    name: ${REMOTE_COLLECTOR_NAME}-collector
    weight: 100
  port:
    targetPort: otlp-http
  tls:
    termination: passthrough
  wildcardPolicy: None
EOF

# Wait for the route hostname to be assigned
REMOTE_ROUTE_HOST=""
until [ -n "${REMOTE_ROUTE_HOST}" ]; do
  REMOTE_ROUTE_HOST=$(oc --context=ossm-kiali-spoke get route "${REMOTE_COLLECTOR_NAME}" \
    -n istio-system \
    -o jsonpath='{.spec.host}' 2>/dev/null || true)
  sleep 3
done
echo "Remote receiver Route: https://${REMOTE_ROUTE_HOST}"
Generate the mTLS certificates with openssl. The same approach used for the Istio CA in the hub/spoke guide. The server certificate includes the Route hostname as a SAN so the spoke-two forwarder can verify it:
OTEL_CERT_DIR="/tmp/otel-mtls"
mkdir -p "${OTEL_CERT_DIR}"

# Self-signed CA
openssl req -x509 -newkey ec -pkeyopt ec_paramgen_curve:P-256 \
  -days 3650 -nodes \
  -keyout "${OTEL_CERT_DIR}/ca.key" \
  -out "${OTEL_CERT_DIR}/ca.crt" \
  -subj "/CN=${REMOTE_COLLECTOR_NAME}-ca" 2>/dev/null

# Server cert (signed by CA) — SANs cover both the in-cluster service and the Route hostname
openssl req -newkey ec -pkeyopt ec_paramgen_curve:P-256 -nodes \
  -keyout "${OTEL_CERT_DIR}/server.key" \
  -out "${OTEL_CERT_DIR}/server.csr" \
  -subj "/CN=${REMOTE_COLLECTOR_NAME}-server" 2>/dev/null

printf "subjectAltName=DNS:%s,DNS:%s.istio-system.svc,DNS:%s.istio-system.svc.cluster.local,DNS:%s" \
  "${REMOTE_COLLECTOR_NAME}-collector" \
  "${REMOTE_COLLECTOR_NAME}-collector" \
  "${REMOTE_COLLECTOR_NAME}-collector" \
  "${REMOTE_ROUTE_HOST}" > "${OTEL_CERT_DIR}/server-ext.cnf"

openssl x509 -req -days 3650 \
  -in "${OTEL_CERT_DIR}/server.csr" \
  -CA "${OTEL_CERT_DIR}/ca.crt" \
  -CAkey "${OTEL_CERT_DIR}/ca.key" -CAcreateserial \
  -extfile "${OTEL_CERT_DIR}/server-ext.cnf" \
  -out "${OTEL_CERT_DIR}/server.crt" 2>/dev/null

# Client cert (signed by same CA)
openssl req -newkey ec -pkeyopt ec_paramgen_curve:P-256 -nodes \
  -keyout "${OTEL_CERT_DIR}/client.key" \
  -out "${OTEL_CERT_DIR}/client.csr" \
  -subj "/CN=${REMOTE_COLLECTOR_NAME}-client" 2>/dev/null

openssl x509 -req -days 3650 \
  -in "${OTEL_CERT_DIR}/client.csr" \
  -CA "${OTEL_CERT_DIR}/ca.crt" \
  -CAkey "${OTEL_CERT_DIR}/ca.key" -CAcreateserial \
  -out "${OTEL_CERT_DIR}/client.crt" 2>/dev/null

echo "Certs generated: $(openssl x509 -noout -subject -in ${OTEL_CERT_DIR}/server.crt)"

# Load certs into Kubernetes Secrets on spoke
oc --context=ossm-kiali-spoke create secret generic "${REMOTE_MTLS_CA_SECRET}" \
  -n istio-system \
  --from-file=tls.crt="${OTEL_CERT_DIR}/ca.crt" \
  --from-file=tls.key="${OTEL_CERT_DIR}/ca.key" \
  --dry-run=client -o yaml | oc --context=ossm-kiali-spoke apply -f -

oc --context=ossm-kiali-spoke create secret tls "${REMOTE_MTLS_SERVER_SECRET}" \
  -n istio-system \
  --cert="${OTEL_CERT_DIR}/server.crt" \
  --key="${OTEL_CERT_DIR}/server.key" \
  --dry-run=client -o yaml | oc --context=ossm-kiali-spoke apply -f -

oc --context=ossm-kiali-spoke create secret tls "${REMOTE_MTLS_CLIENT_SECRET}" \
  -n istio-system \
  --cert="${OTEL_CERT_DIR}/client.crt" \
  --key="${OTEL_CERT_DIR}/client.key" \
  --dry-run=client -o yaml | oc --context=ossm-kiali-spoke apply -f -

echo "Certificates ready"

# Kubernetes may take a moment to restart the crashlooping pod after secrets appear.
# Wait until the deployment has at least one ready replica before checking rollout status.
until oc --context=ossm-kiali-spoke get deployment \
  "${REMOTE_COLLECTOR_NAME}-collector" \
  -n istio-system &>/dev/null; do sleep 3; done

oc --context=ossm-kiali-spoke rollout restart \
  "deployment/${REMOTE_COLLECTOR_NAME}-collector" \
  -n istio-system

oc --context=ossm-kiali-spoke rollout status \
  "deployment/${REMOTE_COLLECTOR_NAME}-collector" \
  -n istio-system --timeout=300s
echo "Remote receiver collector ready"
2.6 Remote Forwarder on Spoke-Two
Sync the mTLS client certificate bundle from spoke to spoke-two, then deploy the forwarder collector on spoke-two. The forwarder receives traces from spoke-two’s Istio proxies and ships them to spoke’s Route with mTLS client authentication:
# Extract the client bundle from spoke
CA_BUNDLE=$(oc --context=ossm-kiali-spoke get secret "${REMOTE_MTLS_CA_SECRET}" \
  -n istio-system -o jsonpath='{.data.tls\.crt}' | base64 -d)
CLIENT_CRT=$(oc --context=ossm-kiali-spoke get secret "${REMOTE_MTLS_CLIENT_SECRET}" \
  -n istio-system -o jsonpath='{.data.tls\.crt}' | base64 -d)
CLIENT_KEY=$(oc --context=ossm-kiali-spoke get secret "${REMOTE_MTLS_CLIENT_SECRET}" \
  -n istio-system -o jsonpath='{.data.tls\.key}' | base64 -d)

# Create the bundle secret on spoke-two
oc --context=ossm-kiali-spoke-two create secret generic "${REMOTE_MTLS_CLIENT_BUNDLE}" \
  -n istio-system \
  --from-literal=ca.crt="${CA_BUNDLE}" \
  --from-literal=tls.crt="${CLIENT_CRT}" \
  --from-literal=tls.key="${CLIENT_KEY}" \
  --dry-run=client -o yaml | oc --context=ossm-kiali-spoke-two apply -f -

# Deploy the forwarder on spoke-two
oc --context=ossm-kiali-spoke-two apply -f - <<EOF
apiVersion: opentelemetry.io/v1beta1
kind: OpenTelemetryCollector
metadata:
  name: otel
  namespace: istio-system
spec:
  mode: deployment
  replicas: 1
  volumeMounts:
  - name: mtls-bundle
    mountPath: /etc/otel/mtls
    readOnly: true
  volumes:
  - name: mtls-bundle
    secret:
      secretName: ${REMOTE_MTLS_CLIENT_BUNDLE}
  config:
    receivers:
      otlp:
        protocols:
          grpc:
            endpoint: 0.0.0.0:4317
          http:
            endpoint: 0.0.0.0:4318
    processors:
      batch: {}
      resource:
        attributes:
        - key: k8s.cluster.name
          action: upsert
          value: ${SPOKE_TWO_CLUSTER_NAME}
    exporters:
      otlp_http/central:
        endpoint: https://${REMOTE_ROUTE_HOST}
        tls:
          cert_file: /etc/otel/mtls/tls.crt
          key_file: /etc/otel/mtls/tls.key
          ca_file: /etc/otel/mtls/ca.crt
    service:
      pipelines:
        traces:
          receivers:
          - otlp
          processors:
          - resource
          - batch
          exporters:
          - otlp_http/central
EOF

until oc --context=ossm-kiali-spoke-two get deployment otel-collector \
  -n istio-system &>/dev/null; do sleep 5; done

oc --context=ossm-kiali-spoke-two rollout status deployment/otel-collector \
  -n istio-system --timeout=300s
echo "Spoke-two remote forwarder ready"
2.7 Configure Istio to Send Traces
Patch both clusters’ Istio CRs to add the OTEL collector as a tracing extension provider, then apply a mesh-level Telemetry CR to enable 100% sampling. Also apply per-namespace Telemetry CRs in the demo namespaces to ensure trace generation from both ambient and sidecar workloads:
# Patch meshConfig on spoke
oc --context=ossm-kiali-spoke patch istio default --type=merge -p '{
  "spec": {
    "values": {
      "meshConfig": {
        "enableTracing": true,
        "extensionProviders": [
          {
            "name": "otel-tracing",
            "opentelemetry": {
              "service": "otel-collector.istio-system.svc.cluster.local",
              "port": 4317
            }
          }
        ]
      }
    }
  }
}'

# Patch meshConfig on spoke-two
oc --context=ossm-kiali-spoke-two patch istio default --type=merge -p '{
  "spec": {
    "values": {
      "meshConfig": {
        "enableTracing": true,
        "extensionProviders": [
          {
            "name": "otel-tracing",
            "opentelemetry": {
              "service": "otel-collector.istio-system.svc.cluster.local",
              "port": 4317
            }
          }
        ]
      }
    }
  }
}'

# Mesh-level Telemetry on both clusters
for CTX in ossm-kiali-spoke ossm-kiali-spoke-two; do
  oc --context="${CTX}" apply -f - <<'EOF'
apiVersion: telemetry.istio.io/v1
kind: Telemetry
metadata:
  name: otel-tracing
  namespace: istio-system
spec:
  tracing:
  - providers:
    - name: otel-tracing
    randomSamplingPercentage: 100
EOF
done

# Per-namespace Telemetry in demo namespaces
for CTX in ossm-kiali-spoke ossm-kiali-spoke-two; do
  for NS in ambient-demo bookinfo; do
    if oc --context="${CTX}" get namespace "${NS}" &>/dev/null; then
      oc --context="${CTX}" apply -f - <<EOF
apiVersion: telemetry.istio.io/v1
kind: Telemetry
metadata:
  name: ${NS}-tracing
  namespace: ${NS}
spec:
  tracing:
  - providers:
    - name: otel-tracing
    randomSamplingPercentage: 100
EOF
    fi
  done
done
echo "Telemetry CRs applied"

# Restart waypoints so they pick up the new tracing config
for NS in ambient-demo; do
  for CTX in ossm-kiali-spoke ossm-kiali-spoke-two; do
    if oc --context="${CTX}" get deployment waypoint -n "${NS}" &>/dev/null; then
      oc --context="${CTX}" rollout restart deployment/waypoint -n "${NS}"
    fi
  done
done
2.8 Enable the Distributed Tracing Console Plugin
The COO distributed tracing plugin adds Observe > Traces to the OpenShift console, providing a UI for browsing and filtering traces from the TempoStack. Kiali’s url_format: "openshift" links go directly to this console page. COO discovers the multi-tenant TempoStack automatically — no additional configuration is needed beyond creating the UIPlugin:
oc --context=ossm-kiali-spoke apply -f - <<'EOF'
apiVersion: observability.openshift.io/v1alpha1
kind: UIPlugin
metadata:
  name: distributed-tracing
spec:
  type: DistributedTracing
EOF

until oc --context=ossm-kiali-spoke get uiplugin distributed-tracing \
  -o jsonpath='{.status.conditions[?(@.type=="Reconciled")].status}' 2>/dev/null | grep -q "True"; do
  echo "Waiting for distributed tracing plugin..."
  sleep 5
done
echo "Distributed tracing plugin ready"
2.9 Configure Kiali for Tempo
Patch the Kiali CR on spoke to enable mesh tracing with Tempo and to emit Kiali server self-traces through the local OTEL collector from §2.4 (otel-collector.istio-system.svc:4317, OTLP gRPC). Self-traces flow through the same collector pipeline as Istio mesh traces and appear on the Kiali workload Traces tab once external_services.tracing is configured.
The url_format: "openshift" and tempo_config settings cause Kiali to use the OpenShift console distributed tracing plugin for UI links. When tenant is set in tempo_config, Kiali automatically appends the tenant API path to internal_url — so providing just the gateway base URL is sufficient.
With url_format: "openshift", Kiali appends /observe/traces?... to external_url, so external_url must be the OCP console base URL — not the Tempo route:
CONSOLE_URL=$(oc --context=ossm-kiali-spoke get route console \
  -n openshift-console \
  -o jsonpath='https://{.spec.host}')
echo "Console URL: ${CONSOLE_URL}"

oc --context=ossm-kiali-spoke patch kiali kiali -n istio-system --type=merge -p "{
  \"spec\": {
    \"server\": {
      \"observability\": {
        \"tracing\": {
          \"enabled\": true,
          \"collector_type\": \"otel\",
          \"collector_url\": \"otel-collector.istio-system.svc:4317\",
          \"otel\": {
            \"protocol\": \"grpc\"
          }
        }
      }
    },
    \"external_services\": {
      \"tracing\": {
        \"enabled\": true,
        \"provider\": \"tempo\",
        \"use_grpc\": false,
        \"internal_url\": \"https://tempo-${TEMPO_STACK_NAME}-gateway.${TEMPO_NAMESPACE}.svc.cluster.local:8080/\",
        \"external_url\": \"${CONSOLE_URL}\",
        \"auth\": {
          \"type\": \"bearer\",
          \"use_kiali_token\": true
        },
        \"tempo_config\": {
          \"name\": \"${TEMPO_STACK_NAME}\",
          \"namespace\": \"${TEMPO_NAMESPACE}\",
          \"tenant\": \"${TEMPO_TENANT}\",
          \"org_id\": \"${TEMPO_TENANT}\",
          \"url_format\": \"openshift\"
        }
      }
    }
  }
}"

oc --context=ossm-kiali-spoke wait kiali kiali \
  -n istio-system \
  --for=condition=Successful \
  --timeout=300s

oc --context=ossm-kiali-spoke rollout status deployment/kiali \
  -n istio-system --timeout=120s
echo "Kiali updated with Tempo config"
2.10 Verify Tempo
# Confirm collectors are running on both clusters
echo "=== Spoke collectors ==="
oc --context=ossm-kiali-spoke get pods -n istio-system \
  -l app.kubernetes.io/managed-by=opentelemetry-operator

echo "=== Spoke-two forwarder ==="
oc --context=ossm-kiali-spoke-two get pods -n istio-system \
  -l app.kubernetes.io/managed-by=opentelemetry-operator

# Confirm Telemetry CRs are in place on both clusters
echo "=== Telemetry CRs ==="
oc --context=ossm-kiali-spoke get telemetry -A
oc --context=ossm-kiali-spoke-two get telemetry -A

# Confirm TempoStack is healthy
oc --context=ossm-kiali-spoke get tempostack "${TEMPO_STACK_NAME}" \
  -n "${TEMPO_NAMESPACE}"
# Confirm the distributed tracing console plugin is reconciled
oc --context=ossm-kiali-spoke get uiplugin distributed-tracing \
  -o jsonpath='{.status.conditions[?(@.type=="Reconciled")].status}{"\n"}'
# Expected: True
Allow a few minutes for traces to accumulate, then verify. Both the OpenShift console and Kiali are running on the spoke cluster — use the ossm-kiali-spoke context to get their URLs:
echo "OpenShift console: $(oc --context=ossm-kiali-spoke get route console -n openshift-console -o jsonpath='https://{.spec.host}')"
echo "Kiali:             $(oc --context=ossm-kiali-spoke get route kiali -n istio-system -o jsonpath='https://{.spec.host}')"
- In the OpenShift console, navigate to Observe > Traces — the distributed tracing plugin should show the TempoStack and allow browsing traces by service and duration. To identify which cluster a trace came from, open a trace and look for the
k8s.cluster.nameresource attribute in the span details, or filter using TraceQL:{ resource.k8s.cluster.name = "spoke" } - In the Kiali UI, navigate to Distributed Tracing in the left nav. Confirm:
- Traces are visible from both
spokeandspoke-twoclusters (open a trace and check thek8s.cluster.nameresource attribute in the span details to identify the cluster) - Cross-cluster traces appear when bookinfo traffic routes from
spoke’sproductpagethrough the East-West gateway tospoke-two’sratings-v2 - The View in Tracing link from a workload detail page opens the OCP console Observe > Traces page scoped to that workload
- On the Kiali workload in the
istio-systemnamespace, the Traces tab lists Kiali server spans (service name matches the Kiali instance, for examplekiali.istio-system)
Cleanup
Remove Perses
monitoring.rhobs CRDs: MCOA owns and uses those APIs independently.
# Revert Kiali Perses config
oc --context=ossm-kiali-spoke patch kiali kiali -n istio-system --type=json \
  -p '[{"op":"remove","path":"/spec/external_services/perses"}]' 2>/dev/null || true

# Remove UIPlugin (disables the Dashboards (Perses) console menu)
oc --context=ossm-kiali-spoke delete uiplugin monitoring --ignore-not-found

# Delete dashboard and datasource resources from the perses namespace
oc --context=ossm-kiali-spoke delete persesdashboard --all -n perses --ignore-not-found
oc --context=ossm-kiali-spoke delete persesdatasource --all -n perses --ignore-not-found

# Delete the Perses server instance (lives in openshift-cluster-observability-operator namespace)
oc --context=ossm-kiali-spoke delete perses perses \
  -n openshift-cluster-observability-operator --ignore-not-found

# Remove cert resources created for Perses mTLS
oc --context=ossm-kiali-spoke delete configmap perses-acm-server-ca \
  -n openshift-cluster-observability-operator --ignore-not-found
oc --context=ossm-kiali-spoke delete secret perses-acm-client-certs \
  -n openshift-cluster-observability-operator --ignore-not-found

# Delete the perses namespace
oc --context=ossm-kiali-spoke delete namespace perses --ignore-not-found

# Remove Perses CRDs only (do NOT remove monitoring.rhobs or observability.openshift.io CRDs —
# those are needed by COO for MCOA and are removed in Guide 1 cleanup)
for suffix in perses.dev; do
  CRDS=$(oc --context=ossm-kiali-spoke get crd \
    --no-headers -o custom-columns=NAME:.metadata.name 2>/dev/null \
    | grep "\.${suffix}$")
  [ -n "${CRDS}" ] && echo "${CRDS}" | xargs oc --context=ossm-kiali-spoke delete crd --ignore-not-found
done
Remove Tempo
# Re-export variables if running cleanup in a fresh shell
export SPOKE_TWO_CLUSTER_NAME="spoke-two"
export TEMPO_NAMESPACE="tempo"
export TEMPO_STACK_NAME="istio"
export TEMPO_TENANT="mesh1"
REMOTE_COLLECTOR_NAME="otel-remote-${SPOKE_TWO_CLUSTER_NAME}"
REMOTE_MTLS_CLIENT_BUNDLE="${REMOTE_COLLECTOR_NAME}-client-bundle"

# Revert Kiali mesh and self-tracing config
oc --context=ossm-kiali-spoke patch kiali kiali -n istio-system --type=json \
  -p '[{"op":"remove","path":"/spec/external_services/tracing"},{"op":"remove","path":"/spec/server/observability/tracing"}]' 2>/dev/null || true

# Remove the distributed tracing console plugin
oc --context=ossm-kiali-spoke delete uiplugin distributed-tracing --ignore-not-found

# Remove Telemetry CRs and meshConfig tracing from both clusters
for CTX in ossm-kiali-spoke ossm-kiali-spoke-two; do
  oc --context="${CTX}" delete telemetry otel-tracing -n istio-system --ignore-not-found
  for NS in ambient-demo bookinfo; do
    oc --context="${CTX}" delete telemetry "${NS}-tracing" -n "${NS}" --ignore-not-found
  done
  oc --context="${CTX}" patch istio default --type=json \
    -p '[{"op":"remove","path":"/spec/values/meshConfig/extensionProviders"},{"op":"remove","path":"/spec/values/meshConfig/enableTracing"}]' \
    2>/dev/null || true
done

# Remove spoke-two forwarder and client bundle secret
oc --context=ossm-kiali-spoke-two delete opentelemetrycollector otel \
  -n istio-system --ignore-not-found
oc --context=ossm-kiali-spoke-two delete secret "${REMOTE_MTLS_CLIENT_BUNDLE}" \
  -n istio-system --ignore-not-found

# Remove spoke collectors, Route, certs, and RBAC
oc --context=ossm-kiali-spoke delete opentelemetrycollector otel \
  "${REMOTE_COLLECTOR_NAME}" -n istio-system --ignore-not-found
oc --context=ossm-kiali-spoke delete route "${REMOTE_COLLECTOR_NAME}" \
  -n istio-system --ignore-not-found
oc --context=ossm-kiali-spoke delete secret \
  "${REMOTE_COLLECTOR_NAME}-ca" \
  "${REMOTE_COLLECTOR_NAME}-server-tls" \
  "${REMOTE_COLLECTOR_NAME}-client-tls" \
  -n istio-system --ignore-not-found
oc --context=ossm-kiali-spoke delete clusterrolebinding \
  tempostack-traces-write-collectors \
  "tempostack-traces-reader-${TEMPO_TENANT}" --ignore-not-found
oc --context=ossm-kiali-spoke delete clusterrole \
  tempostack-traces-write \
  "tempostack-traces-reader-${TEMPO_TENANT}" --ignore-not-found

# Remove TempoStack, SeaweedFS, and namespace
oc --context=ossm-kiali-spoke delete tempostack "${TEMPO_STACK_NAME}" \
  -n "${TEMPO_NAMESPACE}" --ignore-not-found
oc --context=ossm-kiali-spoke delete deployment seaweedfs -n "${TEMPO_NAMESPACE}" --ignore-not-found
oc --context=ossm-kiali-spoke delete pvc seaweedfs-pv-claim -n "${TEMPO_NAMESPACE}" --ignore-not-found
oc --context=ossm-kiali-spoke delete secret tempostack-dev-seaweedfs \
  -n "${TEMPO_NAMESPACE}" --ignore-not-found
oc --context=ossm-kiali-spoke delete namespace "${TEMPO_NAMESPACE}" --ignore-not-found

# Remove Subscriptions (OpenTelemetry on both clusters, Tempo on spoke only)
for CTX in ossm-kiali-spoke ossm-kiali-spoke-two; do
  oc --context="${CTX}" delete subscriptions.operators.coreos.com opentelemetry-product \
    -n openshift-operators --ignore-not-found
done
oc --context=ossm-kiali-spoke delete subscriptions.operators.coreos.com tempo-product \
  -n openshift-operators --ignore-not-found

# Delete pending install plans before removing CSVs — otherwise OLM may recreate CSVs from in-flight plans
for CTX in ossm-kiali-spoke ossm-kiali-spoke-two; do
  oc --context="${CTX}" delete installplan -n openshift-operators --all --ignore-not-found
done

# Remove ALL CSVs — delete the CSV in the operator namespace only; OLM cascades deletion to all copied namespaces automatically
for CTX in ossm-kiali-spoke ossm-kiali-spoke-two; do
  CSV=$(oc --context="${CTX}" get csv -n openshift-operators \
    -l operators.coreos.com/opentelemetry-product.openshift-operators \
    --no-headers -o custom-columns=NAME:.metadata.name 2>/dev/null | head -1)
  if [ -n "${CSV}" ]; then oc --context="${CTX}" delete csv "${CSV}" -n openshift-operators --ignore-not-found; fi
done
CSV=$(oc --context=ossm-kiali-spoke get csv -n openshift-operators \
  -l operators.coreos.com/tempo-product.openshift-operators \
  --no-headers -o custom-columns=NAME:.metadata.name 2>/dev/null | head -1)
if [ -n "${CSV}" ]; then oc --context=ossm-kiali-spoke delete csv "${CSV}" -n openshift-operators --ignore-not-found; fi

# Remove ALL CRDs — you must remove every CRD installed by the Tempo and OpenTelemetry operators or reinstallation will conflict
for CTX in ossm-kiali-spoke ossm-kiali-spoke-two; do
  CRDS=$(oc --context="${CTX}" get crd \
    --no-headers -o custom-columns=NAME:.metadata.name 2>/dev/null \
    | grep "\.opentelemetry\.io$")
  [ -n "${CRDS}" ] && echo "${CRDS}" | xargs oc --context="${CTX}" delete crd --ignore-not-found
done
CRDS=$(oc --context=ossm-kiali-spoke get crd \
  --no-headers -o custom-columns=NAME:.metadata.name 2>/dev/null \
  | grep "\.tempo\.grafana\.com$")
[ -n "${CRDS}" ] && echo "${CRDS}" | xargs oc --context=ossm-kiali-spoke delete crd --ignore-not-found

# Remove the ClusterRole installed by the OpenTelemetry Operator
for CTX in ossm-kiali-spoke ossm-kiali-spoke-two; do
  oc --context="${CTX}" delete clusterrole opentelemetry-operator-metrics-reader --ignore-not-found
done
Remove COO
After the Perses resources have been removed, remove the full COO installation created in Phase 1.1. Leave the monitoring.rhobs CRDs in place because they are managed by MCOA for metric federation:
COO_CSV=$(oc --context=ossm-kiali-spoke get subscription cluster-observability-operator \
  -n openshift-cluster-observability-operator \
  -o jsonpath='{.status.installedCSV}' 2>/dev/null || true)
oc --context=ossm-kiali-spoke delete subscription cluster-observability-operator \
  -n openshift-cluster-observability-operator --ignore-not-found
[ -z "${COO_CSV}" ] || oc --context=ossm-kiali-spoke delete csv "${COO_CSV}" \
  -n openshift-cluster-observability-operator --ignore-not-found
oc --context=ossm-kiali-spoke delete namespace openshift-cluster-observability-operator \
  --ignore-not-found --wait=false