Grafana Tempo
- Grafana Tempo Configuration
- Configuration table
- Tempo tuning
- Tempo cache
- Tempo authentication configuration
Grafana Tempo Configuration
There are two possibilities to integrate Kiali with Grafana Tempo:
- Using the Grafana Tempo API: This option returns the traces from the Tempo API in OpenTelemetry format.
- Using the Jaeger frontend with the Grafana Tempo backend.
- Appendix: Configuration table
Using the Grafana Tempo API
There are two steps to set up Kiali and Grafana Tempo:
- Set up the Kiali CR updating the Tracing and Grafana sections.
- Set up a Tempo data source in Grafana.
Set up the Kiali CR
This is a configuration example to set up Kiali tracing with Grafana Tempo:
spec:
  external_services:
    tracing:
      # Enabled by default. Kiali will anyway fallback to disabled if
      # Tempo is unreachable.
      enabled: true
      health_check_url: "https://tempo-instance.grafana.net"
      # Tempo service name is "query-frontend" and is in the "tempo" namespace.
      # Make sure the URL you provide corresponds to the non-GRPC enabled endpoint
      # It does not support grpc yet, so make sure "use_grpc" is set to false.
      internal_url: "http://tempo-tempo-query-frontend.tempo.svc.cluster.local:3200/"
      provider: "tempo"
      tempo_config:
        org_id: "1"
        datasource_uid: "a8d2ef1c-d31c-4de5-a90b-e7bc5252cd00"
        url_format: "grafana"
      use_grpc: false
      # Public facing URL of Tempo
      external_url: "https://grafana-istio-system.apps-crc.testing/"
Kiali uses the external_url to construct “View in tracing” links in the UI. For the Tempo provider the default url_format is grafana. So, by default the URL will have the Grafana UI format when linking to specific services and traces.
It is also possible to set url_format to openshift. In this case the URL will redirect to the UI Plugin in the OpenShift console. When it is set to openshift, there are other settings as well:
spec:
  external_services:
    tracing:
      tempo_config:
        name: "sample"
        namespace: "tempo"
        tenant: "default"
        url_format: "openshift"
When the tenant is specified, if internal_url doesn’t have a path, it will be autocompleted with the Tempo path. For this example:
internal_url: https://tempo-sample-gateway.tempo.svc.cluster.local:8080/
Will be autocompleted to: https://tempo-sample-gateway.tempo.svc.cluster.local:8080/api/traces/v1/{tenant}/tempo
The other valid option for url_format is jaeger, used when the Jaeger UI is available in Tempo.
Set up a Tempo Datasource in Grafana
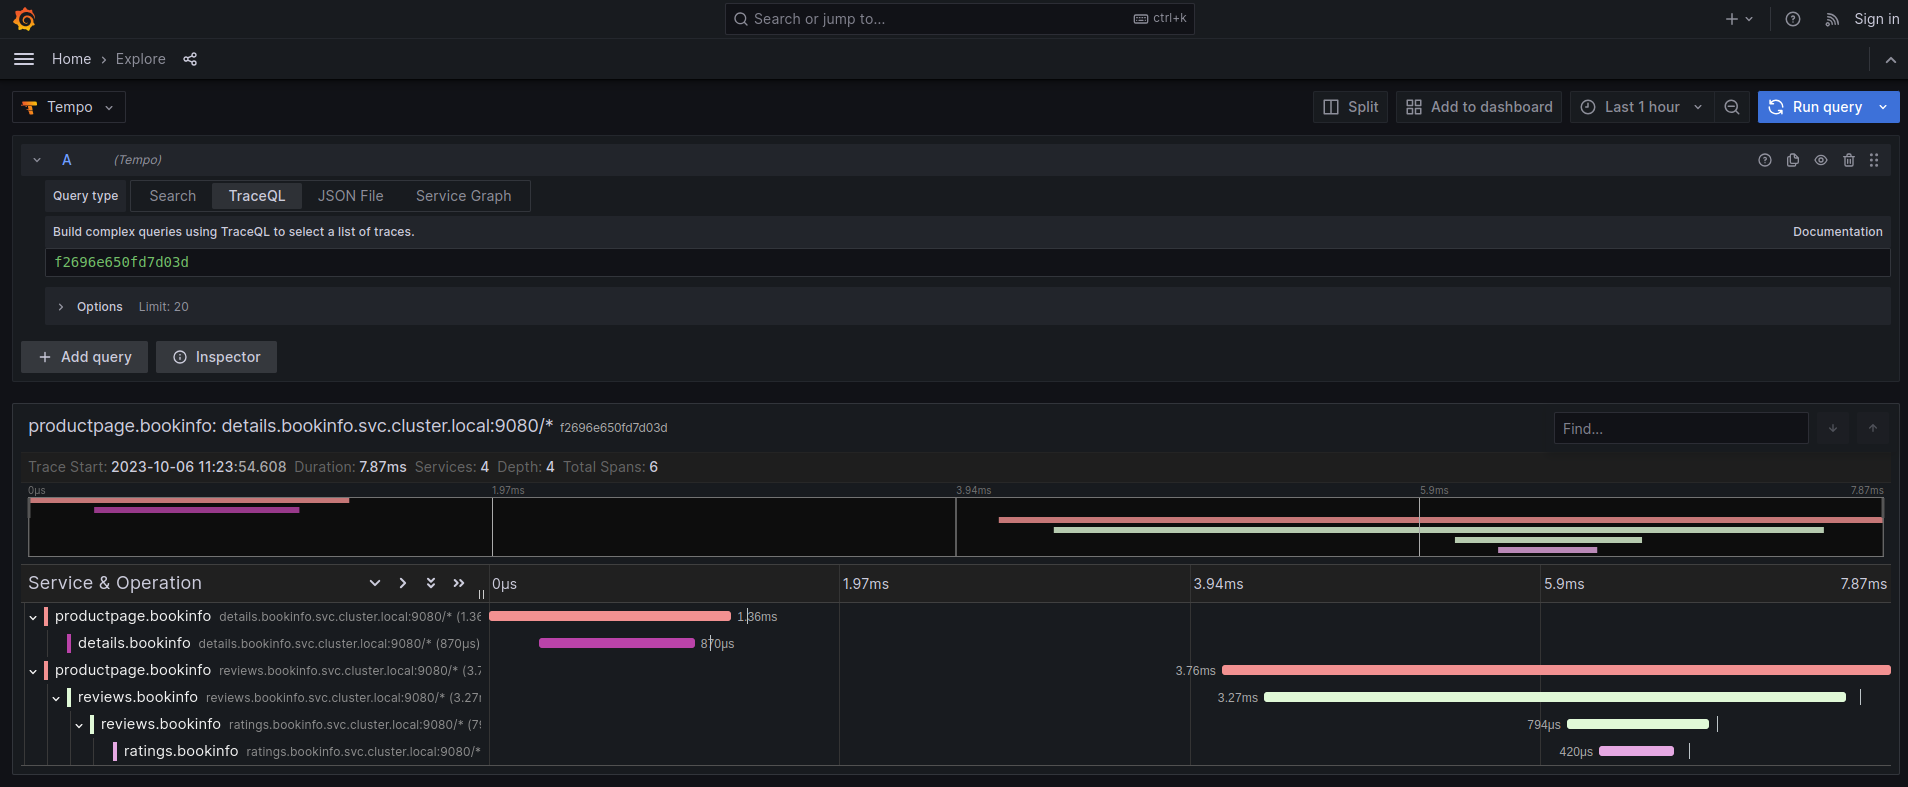
We can optionally set up a default Tempo datasource in Grafana so that you can view the Tempo tracing data within the Grafana UI, as you see here:
To set up the Tempo datasource, go to the Home menu in the Grafana UI, click Data sources, then click the Add new data source button and select the Tempo data source. You will then be asked to enter some data to configure the new Tempo data source:
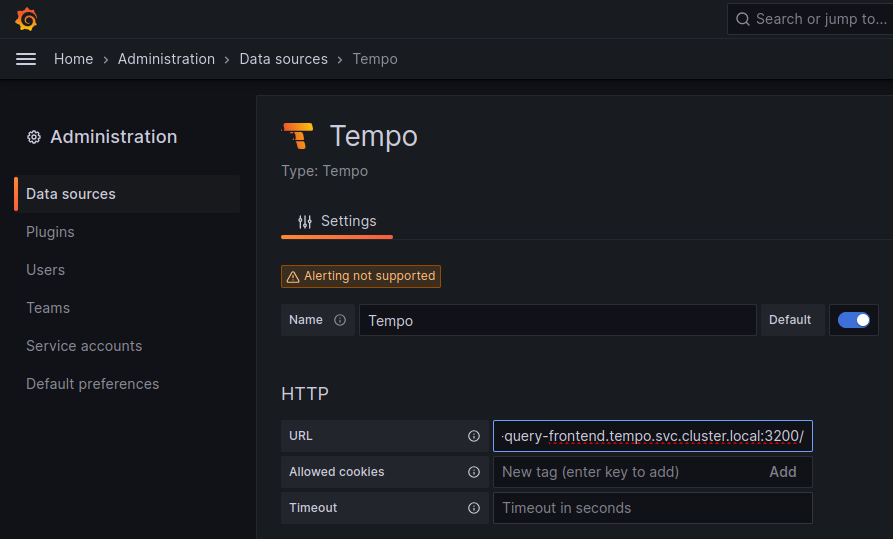
The most important values to set up are the following:
- Mark the data source as default, so the URL that Kiali uses will redirect properly to the Tempo data source.
- Update the HTTP URL. This is the internal URL of the HTTP tempo frontend service. e.g.
http://tempo-tempo-query-frontend.tempo.svc.cluster.local:3200/
Additional configuration
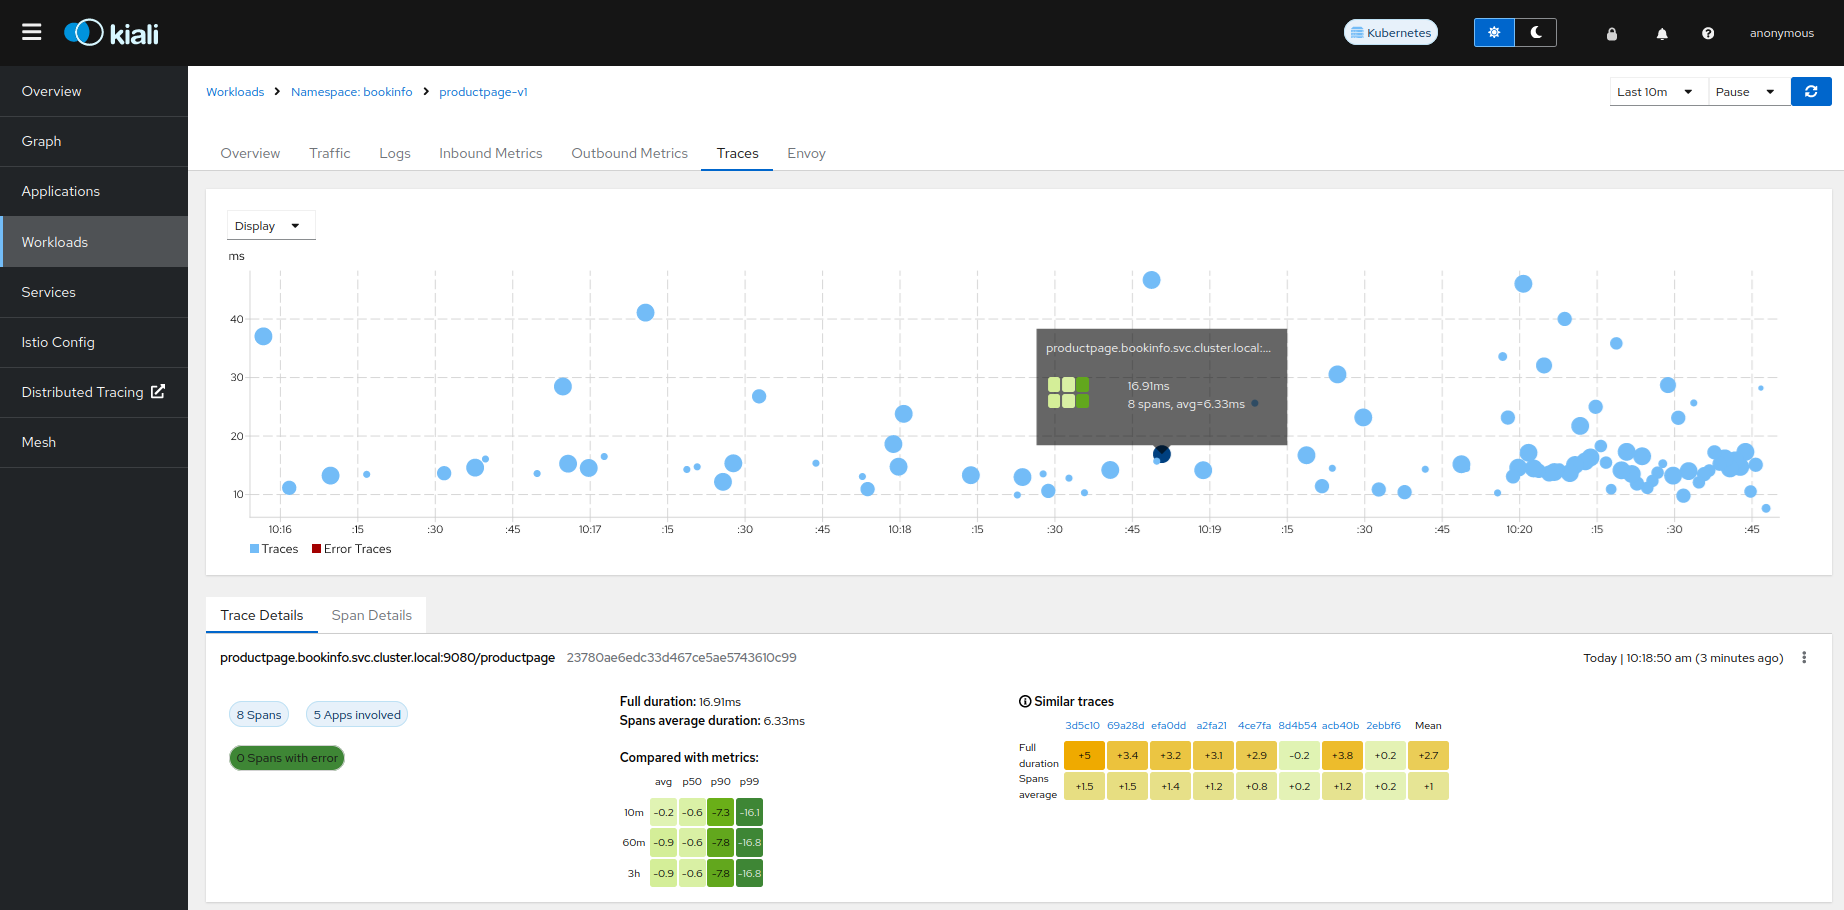
The Traces tab in the Kiali UI will show your traces in a bubble chart:
Increasing performance is achievable by enabling gRPC access, specifically for query searches. However, accessing the HTTP API will still be necessary to gather information about individual traces. This is an example to configure the gRPC access:
spec:
  external_services:
    tracing:
      enabled: true
      # grpc port defaults to 9095
      grpc_port: 9095
      internal_url: "http://query-frontend.tempo:3200"
      provider: "tempo"
      use_grpc: true
      external_url: "http://my-tempo-host:3200"
Service check URL
By default, Kiali will check the service health in the endpoint /status/services, but sometimes, this is exposed in a different url, which can lead to a component unreachable message:
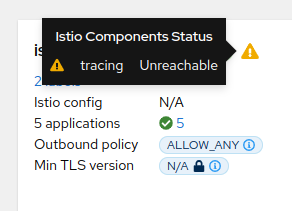
This can be changed with the health_check_url configuration option.
spec:
  external_services:
    tracing:
      health_check_url: "http://query-frontend.tempo:3200"
Configuration for the Grafana Tempo Datasource
In order to correctly redirect Kiali to the right Grafana Tempo Datasource, there are a couple of configuration options to update:
spec:
  external_services:
    tracing:
      tempo_config:
        org_id: "1"
        datasource_uid: "a8d2ef1c-d31c-4de5-a90b-e7bc5252cd00"
org_id is usually not needed since “1” is the default value which is also Tempo’s default org id.
The datasource_uid needs to be updated in order to redirect to the right datasource in Grafana versions 10 or higher.
Using the Jaeger frontend with Grafana Tempo tracing backend
It is possible to use the Grafana Tempo tracing backend exposing the Jaeger API. tempo-query is a Jaeger storage plugin. It accepts the full Jaeger query API and translates these requests into Tempo queries.
Since Tempo is not yet part of the built-in addons that are part of Istio, you need to manage your Tempo instance.
Tanka
The official Grafana Tempo documentation explains how to deploy a Tempo instance using Tanka. You will need to tweak the settings from the default Tanka configuration to:
- Expose the Zipkin collector
- Expose the GRPC Jaeger Query port
When the Tempo instance is deployed with the needed configurations, you have to
set
meshConfig.defaultConfig.tracing.zipkin.address
from Istio to the Tempo Distributor service and the Zipkin port. Tanka will deploy
the service in distributor.tempo.svc.cluster.local:9411.
The external_services.tracing.internal_url Kiali option needs to be set to:
http://query-frontend.tempo.svc.cluster.local:16685.
Tempo Operator
The Tempo Operator for Kubernetes provides a native Kubernetes solution to deploy Tempo easily in your system.
After installing the Tempo Operator in your cluster, you can create a new Tempo instance with the following CR:
kubectl create namespace tempo
kubectl apply -n tempo -f - <<EOF
apiVersion: tempo.grafana.com/v1alpha1
kind: TempoStack
metadata:
  name: smm
spec:
  storageSize: 1Gi
  storage:
    secret:
      type: s3
      name: object-storage
  template:
    queryFrontend:
      component:
        resources:
          limits:
            cpu: "2"
            memory: 2Gi
      jaegerQuery:
        enabled: true
        ingress:
          type: ingress
EOF
Note the name of the bucket where the traces will be stored in our example is
called object-storage. Check the
Tempo Operator
documentation to know more about what storages are supported and how to create
the secret properly to provide it to your Tempo instance.
Now, you are ready to configure the
meshConfig.defaultConfig.tracing.zipkin.address
field in your Istio installation. It needs to be set to the 9411 port of the
Tempo Distributor service. For the previous example, this value will be
tempo-smm-distributor.tempo.svc.cluster.local:9411.
Now, you need to configure the internal_url setting from Kiali to access
the Jaeger API. You can point to the 16685 port to use GRPC or 16686 if not.
For the given example, the value would be
http://tempo-ssm-query-frontend.tempo.svc.cluster.local:16685.
There is a related tutorial with detailed instructions to setup Kiali and Grafana Tempo with the Operator.
Configuration table
Supported versions
Kiali Version |
Jaeger |
Tempo |
Tempo with JaegerQuery |
|---|---|---|---|
| <= 1.79 (OSSM 2.5) | ✅ | ❌ | ✅ |
| > 1.79 | ✅ | ✅ | ✅ |
Minimal configuration for Kiali <= 1.79
In external_services.tracing
http |
grpc |
|
|---|---|---|
| Jaeger | .internal_url = 'http://jaeger_service_url:16686/jaeger'.use_grpc = false |
.internal_url = 'http://jaeger_service_url:16685/jaeger'.use_grpc = true (Not required: by default) |
| Tempo | .internal_url = 'http://query_frontend_url:16686'.use_grpc = false |
.internal_url = 'http://query_frontend_url:16685' .use_grpc = true (Not required: by default) |
Minimal configuration for Kiali > 1.79
http |
grpc |
|
|---|---|---|
| Jaeger | .internal_url = 'http://jaeger_service_url:16686/jaeger'.use_grpc = false |
.internal_url = 'http://jaeger_service_url:16685/jaeger' .use_grpc = true (Not required: by default) |
| Tempo | internal_url = 'http://query_frontend_url:3200'.use_grpc = false.provider = 'tempo' |
.internal_url = 'http://query_frontend_url:3200'.grpc_port: 9095 .provider: 'tempo'.use_grpc = true (Not required: by default) |
Tempo tuning
Resources consumption
Grafana Tempo is a powerful tool, but it can lead to performance issues when not configured correctly. For example, the following configuration is not recommended and may lead to OOM issues for simple queries in the query-frontend component:
spec:
  resources:
    total:
      limits:
        memory: 2Gi
        cpu: 2000m
These resources are shared between all the Tempo components. When needed, apply resources to each specific component, instead of applying the resources globally:
spec:
  template:
    queryFrontend:
      component:
        resources:
          limits:
            cpu: "2"
            memory: 2Gi
This Grafana Dashboard is available to measure the resources used in the tempo namespace.
Caching
Tempo offers multi-level caching that is used by default with Tanka and Helm deployment examples. It uses external cache, supporting Memcached and Redis. The lower level cache has a higher hit rate, and caches bloom filters and parquet data. The higher level caches frontend-search data.
Optimizing the cache depends on the application usage, and can be done modifying different parameters:
- Connection limit for MemCached: Should be increased in large deployments, as MemCached is set to 1024 by default.
- Cache size control: Should be increased when the working set is larger than the size of cache.
Tune search pipeline
There are many parameters to tune the search pipeline, some of these:
- max_concurrent_queries: If it is too high it can cause OOM.
- concurrent_jobs: How many jobs are done concurrently.
- max_retries: When it is too high it can result in a lot of load.
Dedicated attribute columns
When using the vParquet3 storage format , defining dedicated attribute columns can improve the query performance. In order to best choose those columns (Up to 10), a good criteria is to choose attributes that contribute growing the block size (And not those commonly used).
Tempo authentication configuration
The Kiali CR provides authentication configuration that will be used also for querying the version check to provide information in the Mesh graph.
spec:
  external_services:
    tracing:
      enabled: true
      auth:
        insecure_skip_verify: false
        password: "pwd"
        token: ""
        type: "basic"
        use_kiali_token: false
        username: "user"
      health_check_url: ""
To configure a secret to be used as a password, see this FAQ entry.
To authenticate using OAuth2 client_credentials flow, set type: "oauth2" and provide the oauth2 block:
spec:
  external_services:
    tracing:
      use_grpc: false           # must be false; oauth2 token injection is not implemented for gRPC transport
      auth:
        type: "oauth2"
        oauth2:
          client_id: "my-client-id"
          client_secret: "secret:my-oauth2-secret:client_secret"
          token_url: "https://idp.example.com/token"
          scopes: []            # optional: list of OAuth2 scopes to request
          audience: ""          # optional: some providers require this
          auth_style: "header"  # "header" (default) or "params"
use_grpc: false. OAuth2 token injection is not implemented for gRPC transport.
insecure_skip_verify applies only to the Tempo connection, not to the OAuth2 token endpoint. The token endpoint always validates TLS certificates. To trust a private CA for the token endpoint, add the CA to the kiali-cabundle ConfigMap as described in the TLS Configuration page.
The client_secret field supports the secret:<secretName>:<secretKey> pattern for automatic secret mounting and rotation without pod restart. See the FAQ entry for details.
TLS Certificate Configuration
If your Tempo server uses HTTPS with a certificate issued by a private CA, see the TLS Configuration page to learn how to configure Kiali to trust your CA.
Tempo cache
Kiali 2.2 includes a simple tracing cache for Tempo that stores the last N traces. By default, it is enabled and it keeps the last 200 traces. It can be modified in the Kiali CR with:
spec:
  external_services:
    tracing:
      enabled: true
      tempo_config:
        cache_enabled: true
        cache_capacity: 200
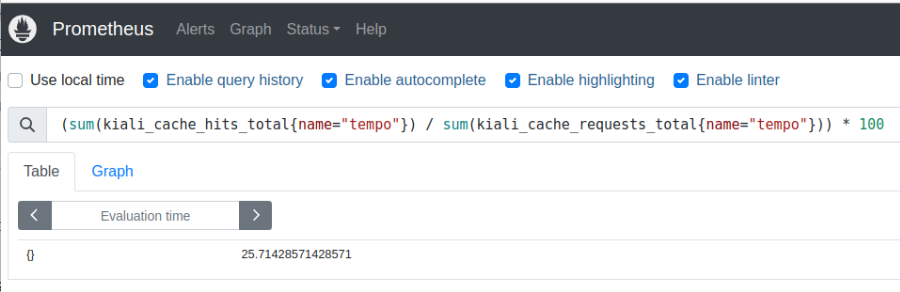
Kiali emits some cache metrics. The following query obtains the cache hit rate:
(sum(kiali_cache_hits_total{name="tempo"})/sum(kiali_cache_requests_total{name="tempo"})) * 100