Observe the Mesh
Enable Sidecars in All Workloads
An Istio sidecar proxy connects a workload to the control plane and enables service mesh functionality.
Sidecars automatically collect metrics, access logs, and distributed traces — a major observability benefit of the mesh.
In Join the Mesh we injected a sidecar only into the control workload. The rest of the Travel Demo still lacks full mesh visibility.
Step 1
Use the Traffic Graph to identify missing sidecars in the Travel Demo- Open Traffic Graph.
- Select all three Travel Demo namespaces (
travel-control,travel-portal, andtravel-agency). - Note the Graph Type menu → if necessary, set to the default: Versioned App graph.
- Note the Display menu → if necessary, enable Missing Sidecars (under Show Badges).
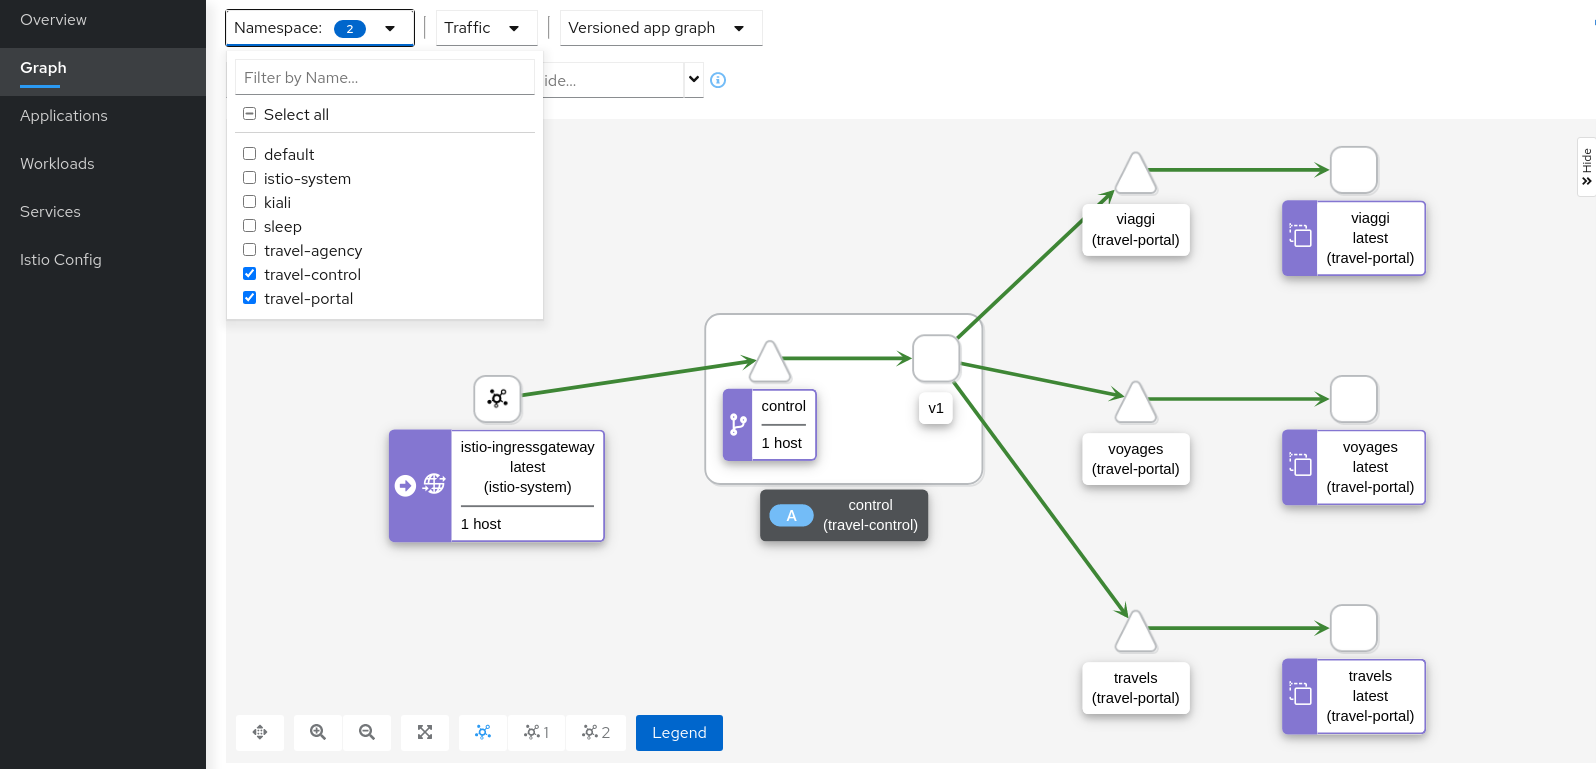
The control workload reports telemetry for its traffic, but visibility is incomplete because travel-portal and travel-agency workloads still lack sidecar proxies.
Step 2
Enable proxy injection in travel-portal and travel-agencyIn Join the Mesh we enabled injection for a single workload on purpose. For the remaining namespaces, a common pattern is to label namespaces before rollout so Istio injects sidecars automatically.
Label the namespaces and restart the deployments:
kubectl label namespace travel-agency istio-injection=enabled
kubectl label namespace travel-portal istio-injection=enabled

kubectl rollout restart deploy -n travel-portal
kubectl rollout restart deploy -n travel-agency
Kind
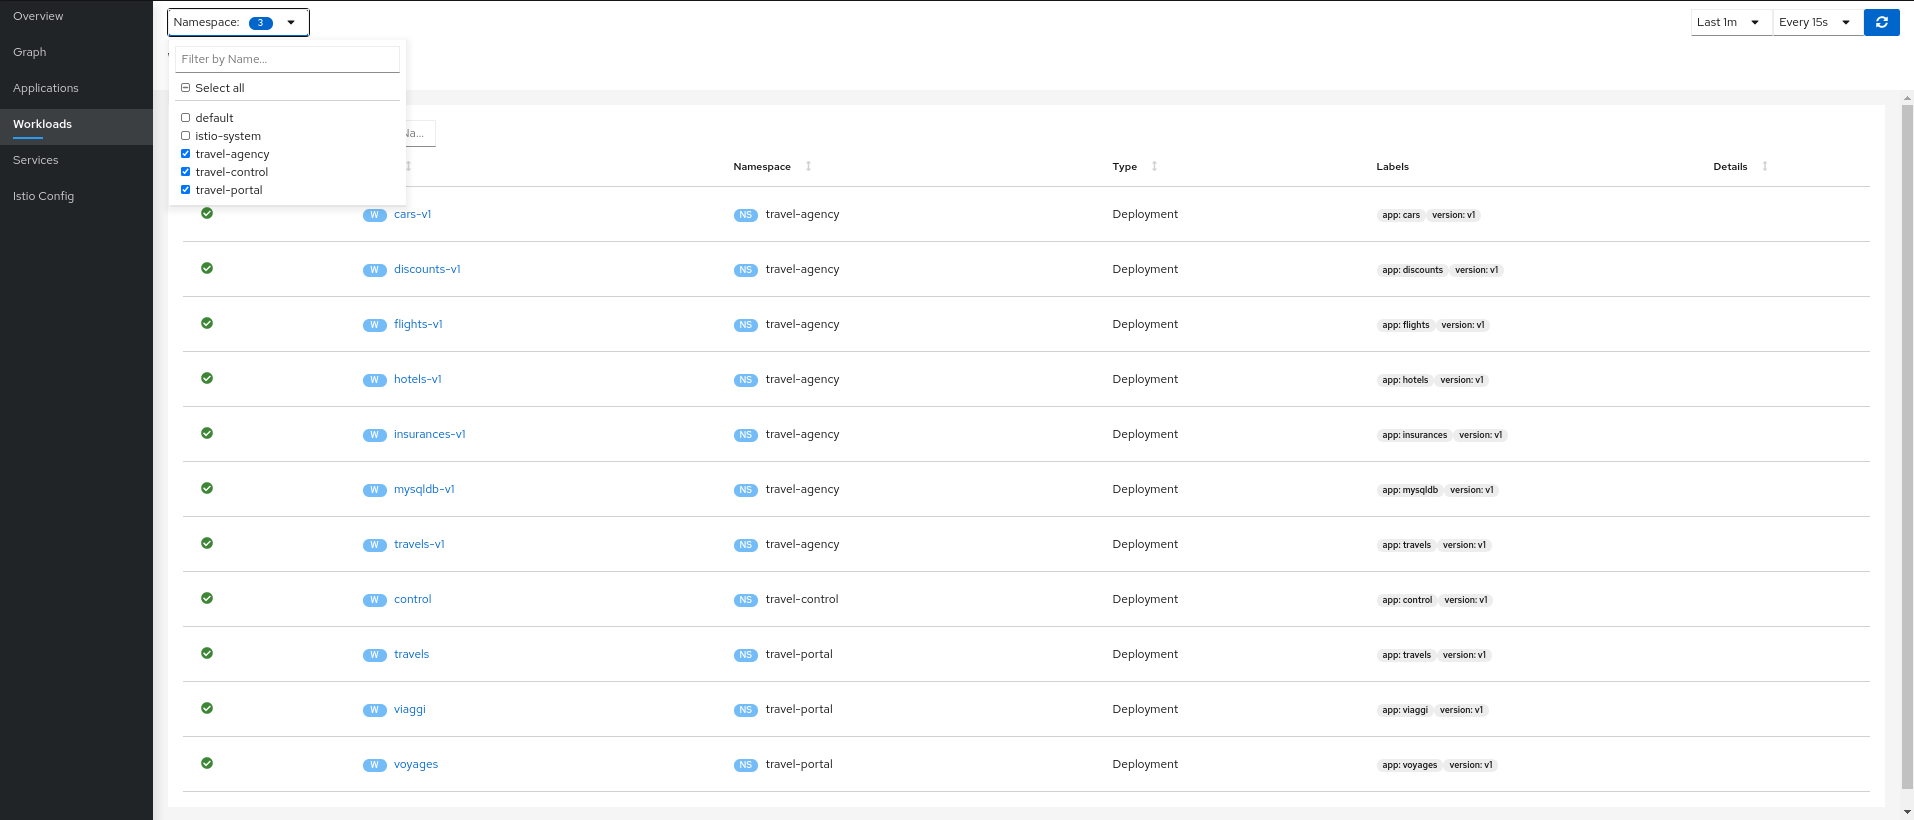
You can also enable injection from Kiali on each namespace (Namespaces → namespace detail → Actions → Enable Auto Injection), then restart workloads the same way.Verify that workloads in all three demo namespaces have sidecars. Pods should show 2/2 ready (application + istio-proxy):
kubectl get pods -n travel-portal
kubectl get pods -n travel-agency
On the Workloads page, missing-sidecar badges should be gone for the restarted pods.
Step 3
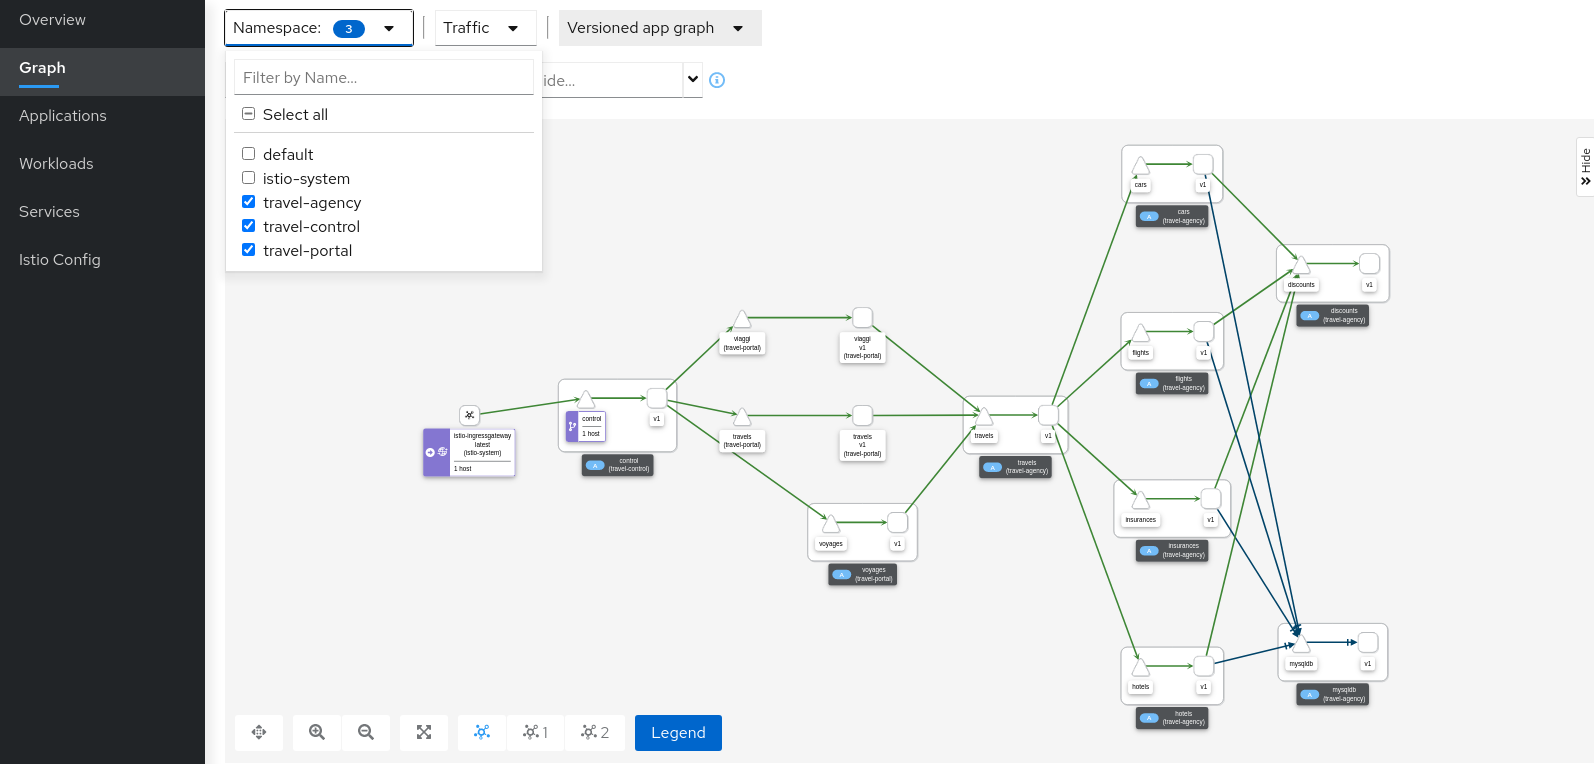
Verify updated telemetry for travel-portal and travel-agencyReturn to Traffic Graph, keep all three Travel Demo namespaces selected, and refresh if needed. You should now see traffic across the full demo topology.
Graph Walkthrough
The graph provides a powerful set of graph features to visualize service mesh traffic.
In this section we use the graph to explore the Travel Demo and identify the busiest services.
Step 1
Select all travel- namespaces and enable Traffic Distribution edge labels- Open Traffic Graph.
- Select
travel-control,travel-portal, andtravel-agency. - Open Display → under Show Edge Labels, enable Traffic Distribution.
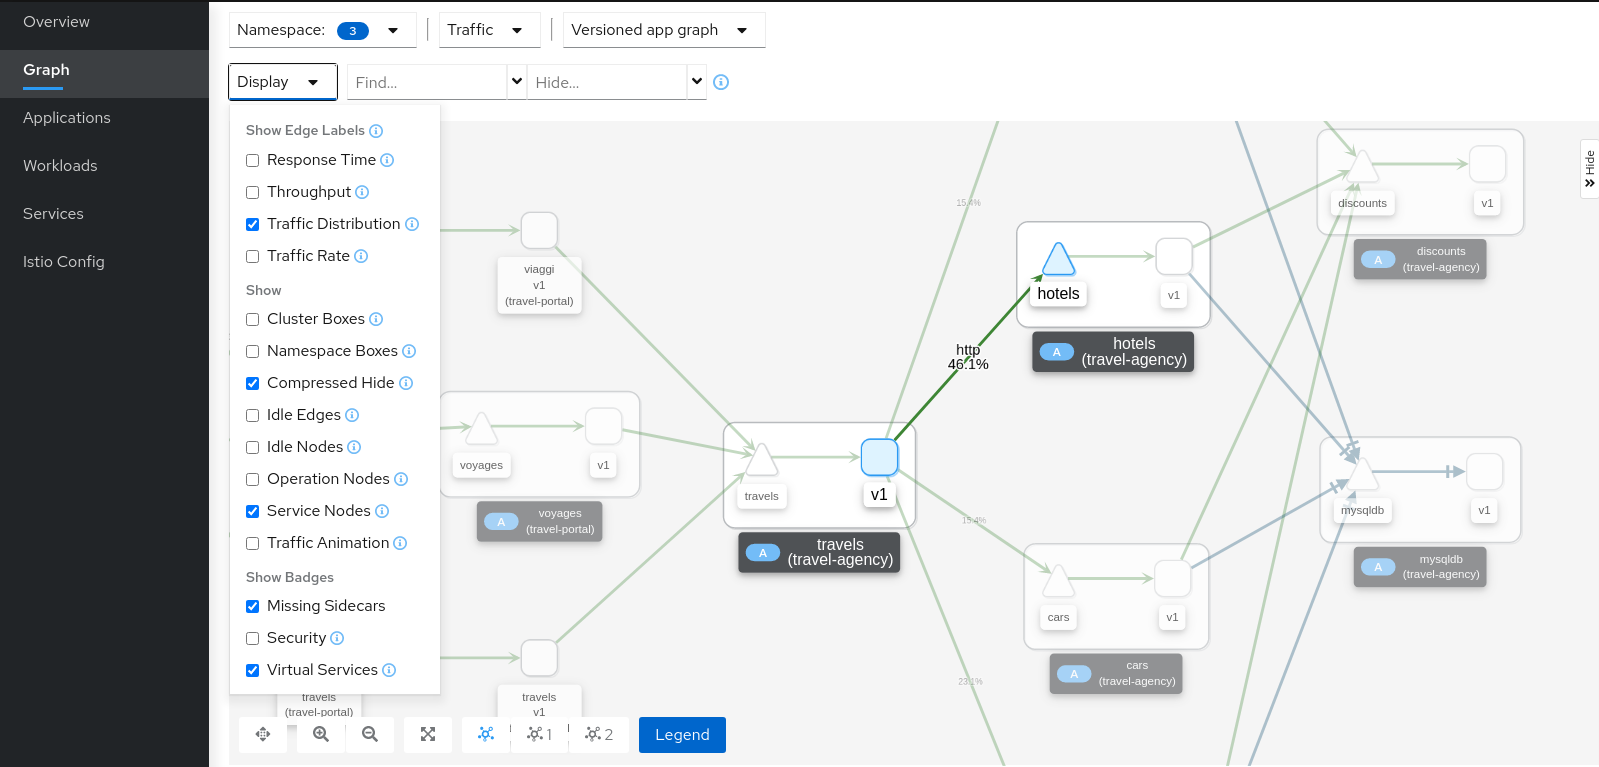
The mesh looks healthy, but note that the hotels service carries more load than other services in travel-agency.
Step 2
Select the hotels service and inspect a trace in the summary panel- Click the hotels service node.
- In the summary panel on the right, open the Traces tab.
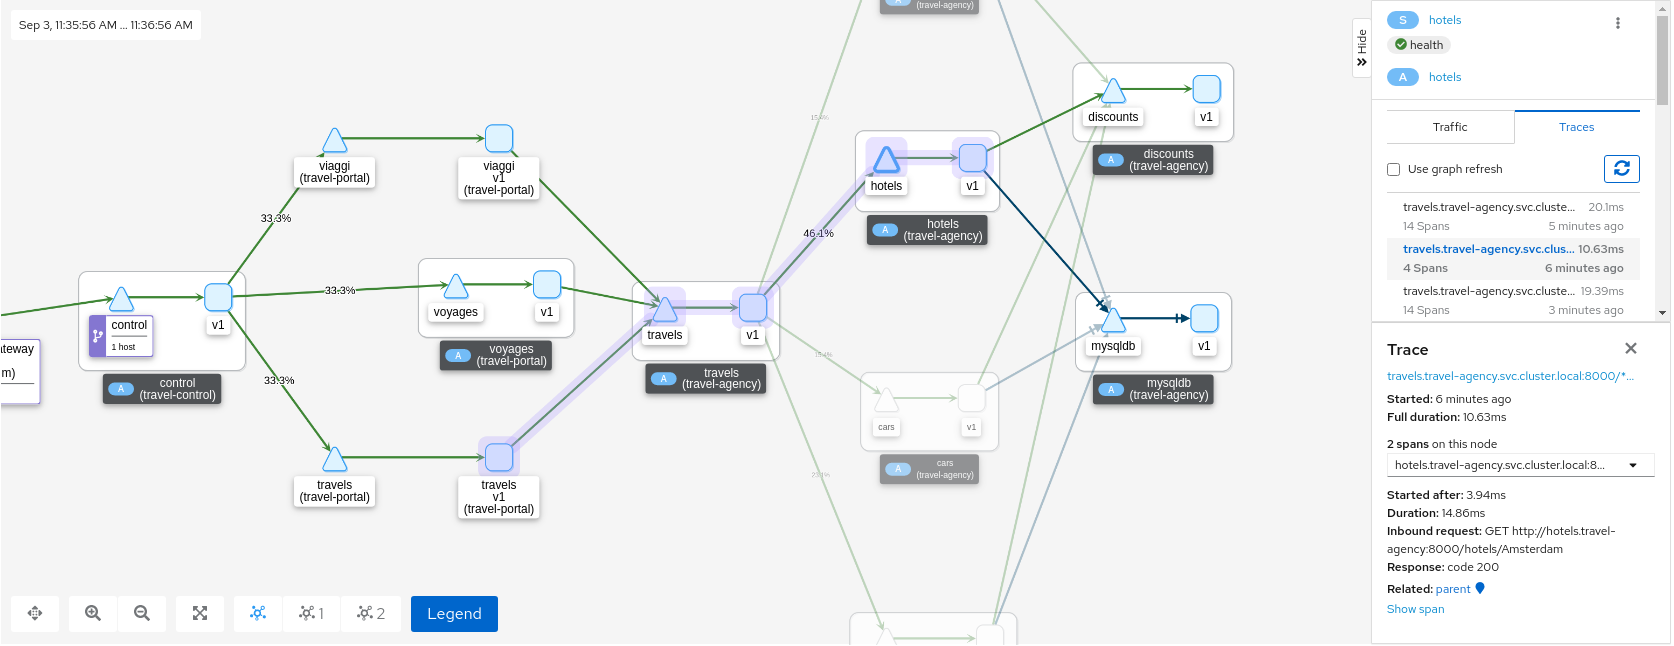
- Select a trace to inspect.
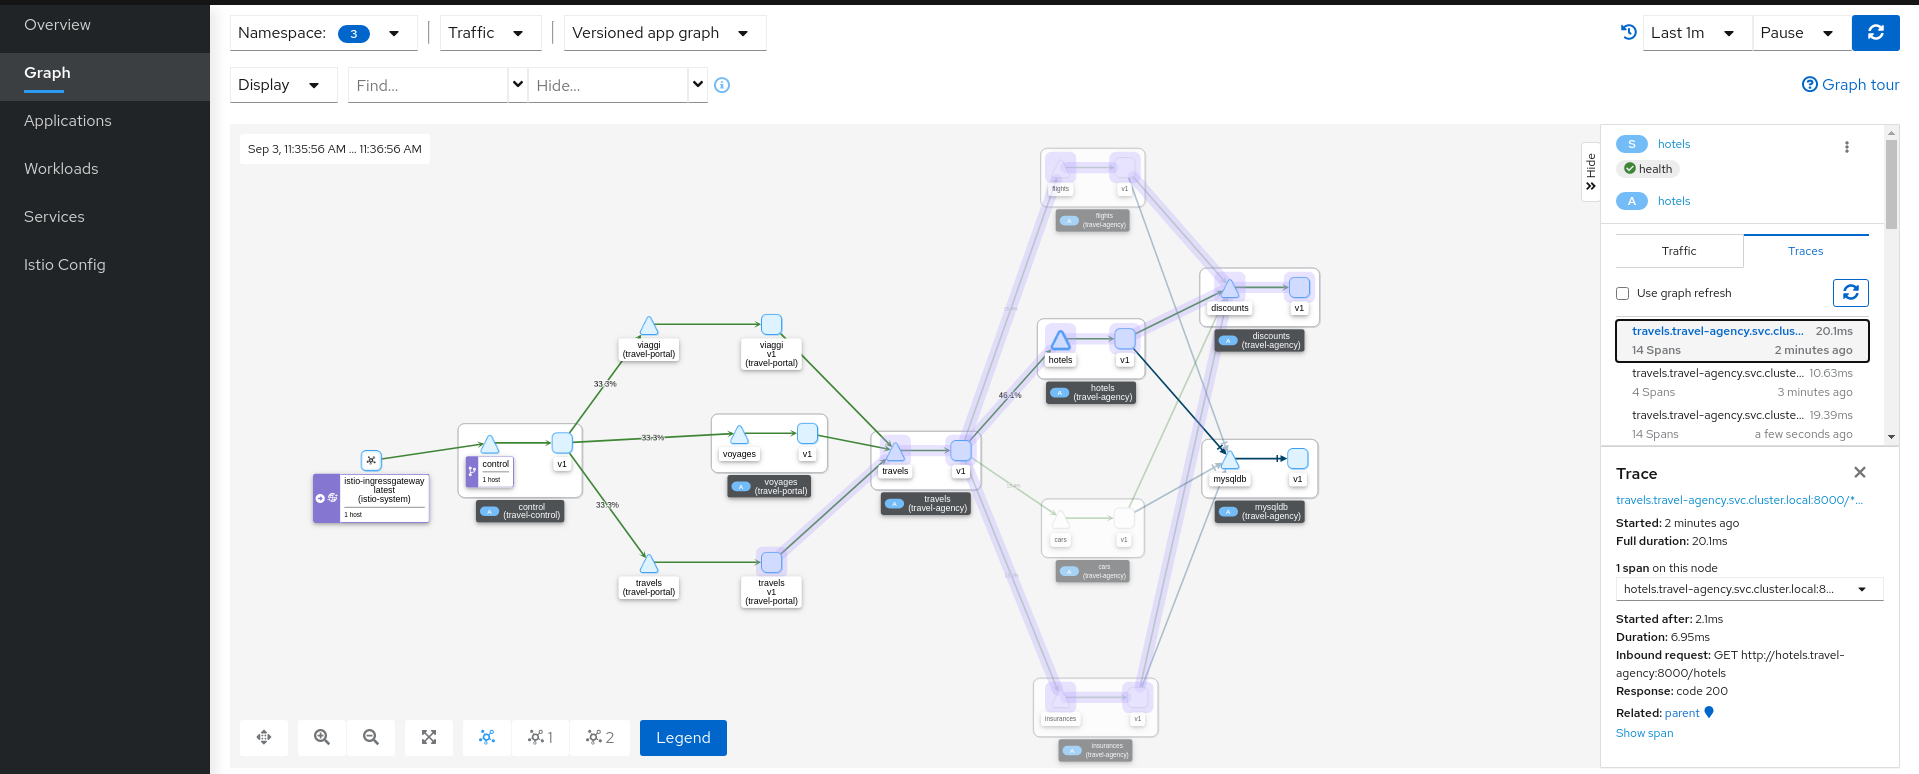
Combining telemetry and tracing shows traces that start from a portal and involve multiple services, and others that call only the hotels service.
Step 3
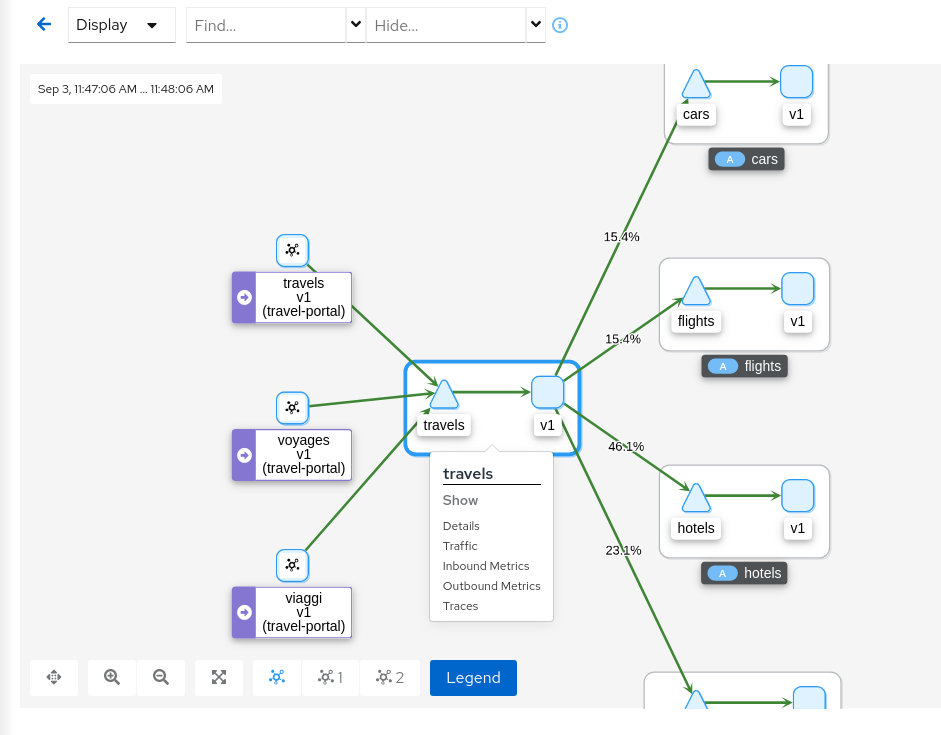
Drill into the main travels application graph- Right-click the travels application node. Right-click provides shortcuts to other Kiali pages.
- Select Node Graph.
The graph focuses on the selected element so you can study one part of the topology in detail.
Application Details
Kiali provides detail views for applications, workloads, and services.
These views show structure, health, metrics, logs, traces, and Istio configuration for each component.
In this section we examine the main travels application in travel-agency.
Step 1
Navigate to the travels application- Open Applications.
- Select the travel-agency namespace.
- Click the travels application.
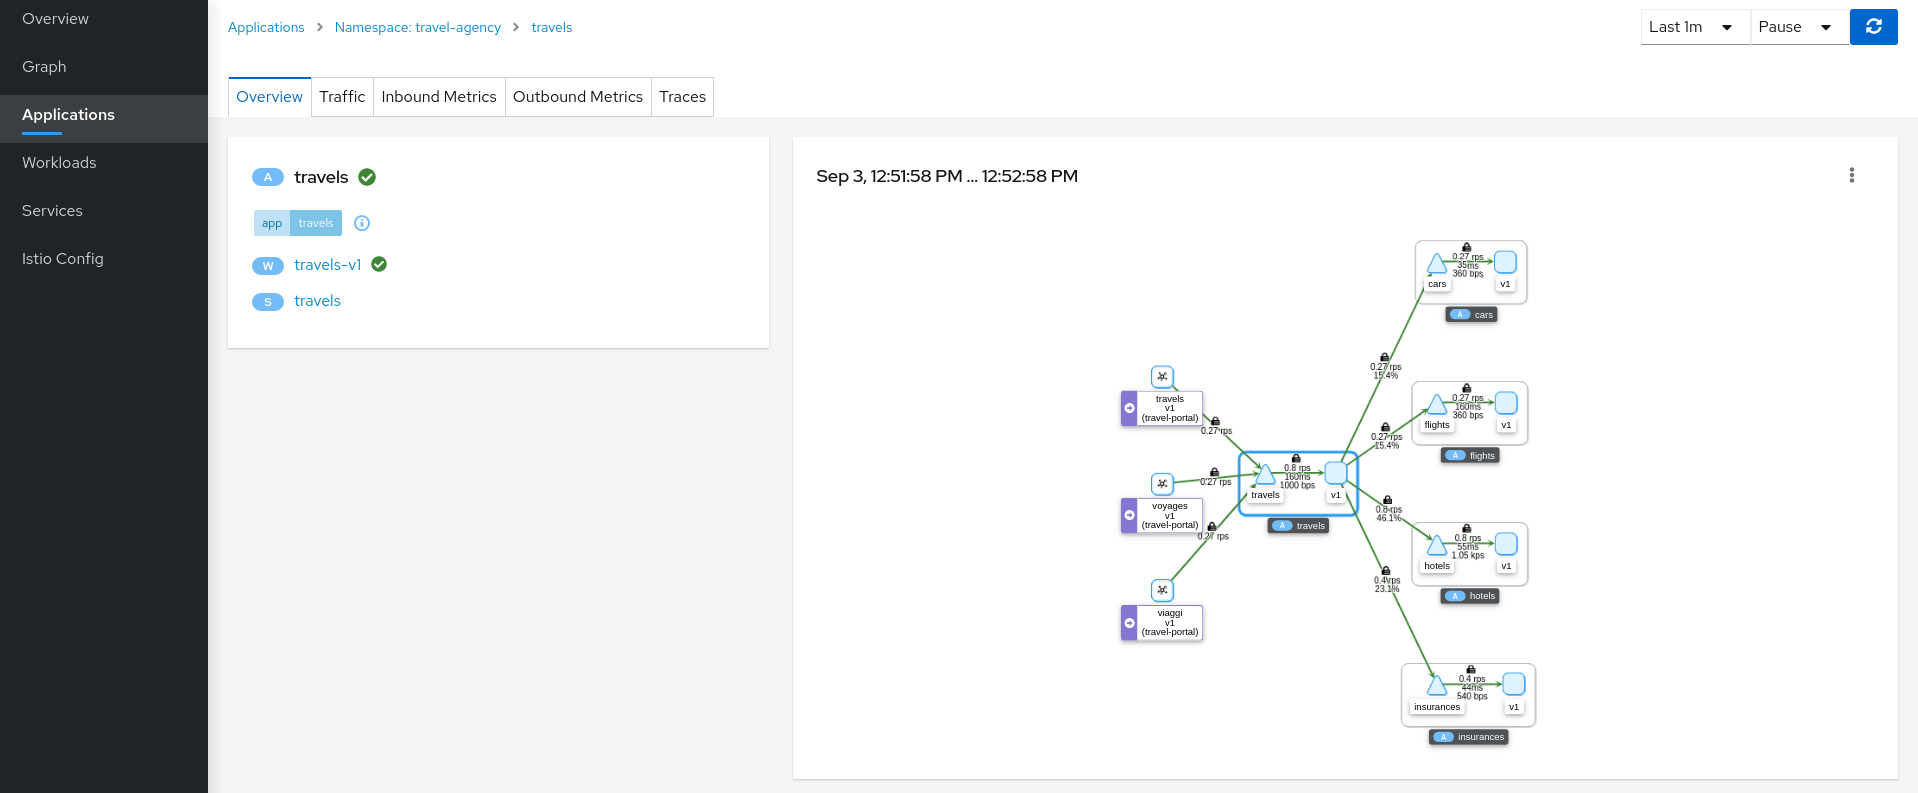
An application groups workloads and services that share the same application label. Telemetry and tracing signals are grouped by application even when multiple workloads are involved.
At this point the travels application consists of a travels-v1 workload exposed through the travels service. Click the travels-v1 workload link in the application overview.
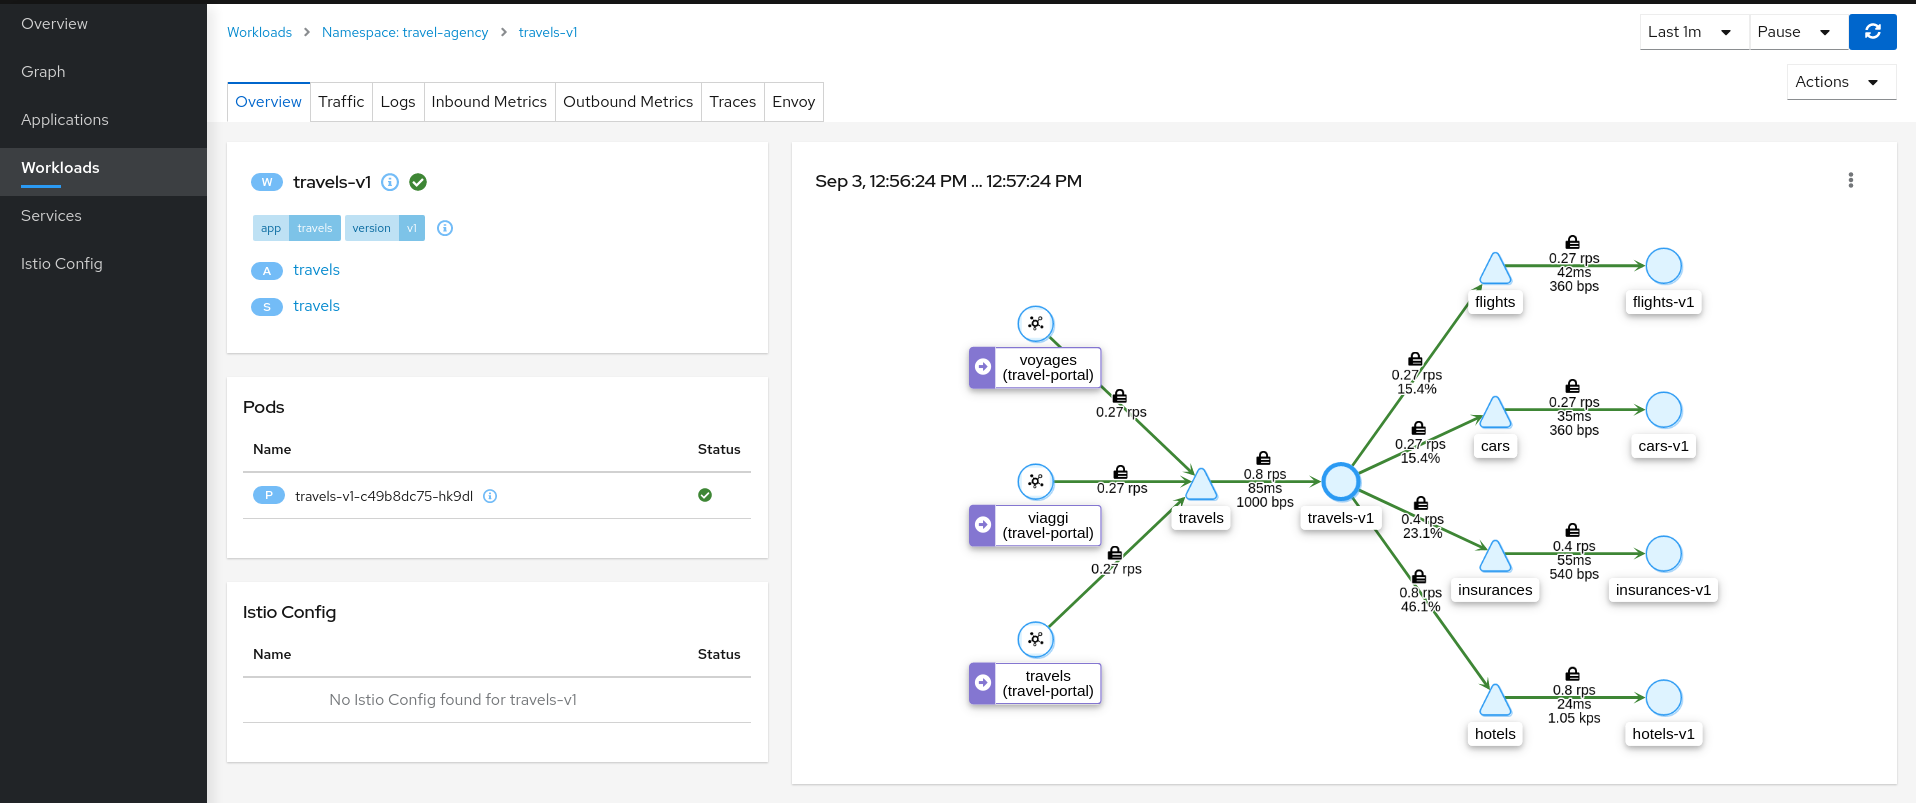
Step 2
Examine Outbound Metrics for travels-v1Open the Outbound Metrics tab on the travels-v1 workload.
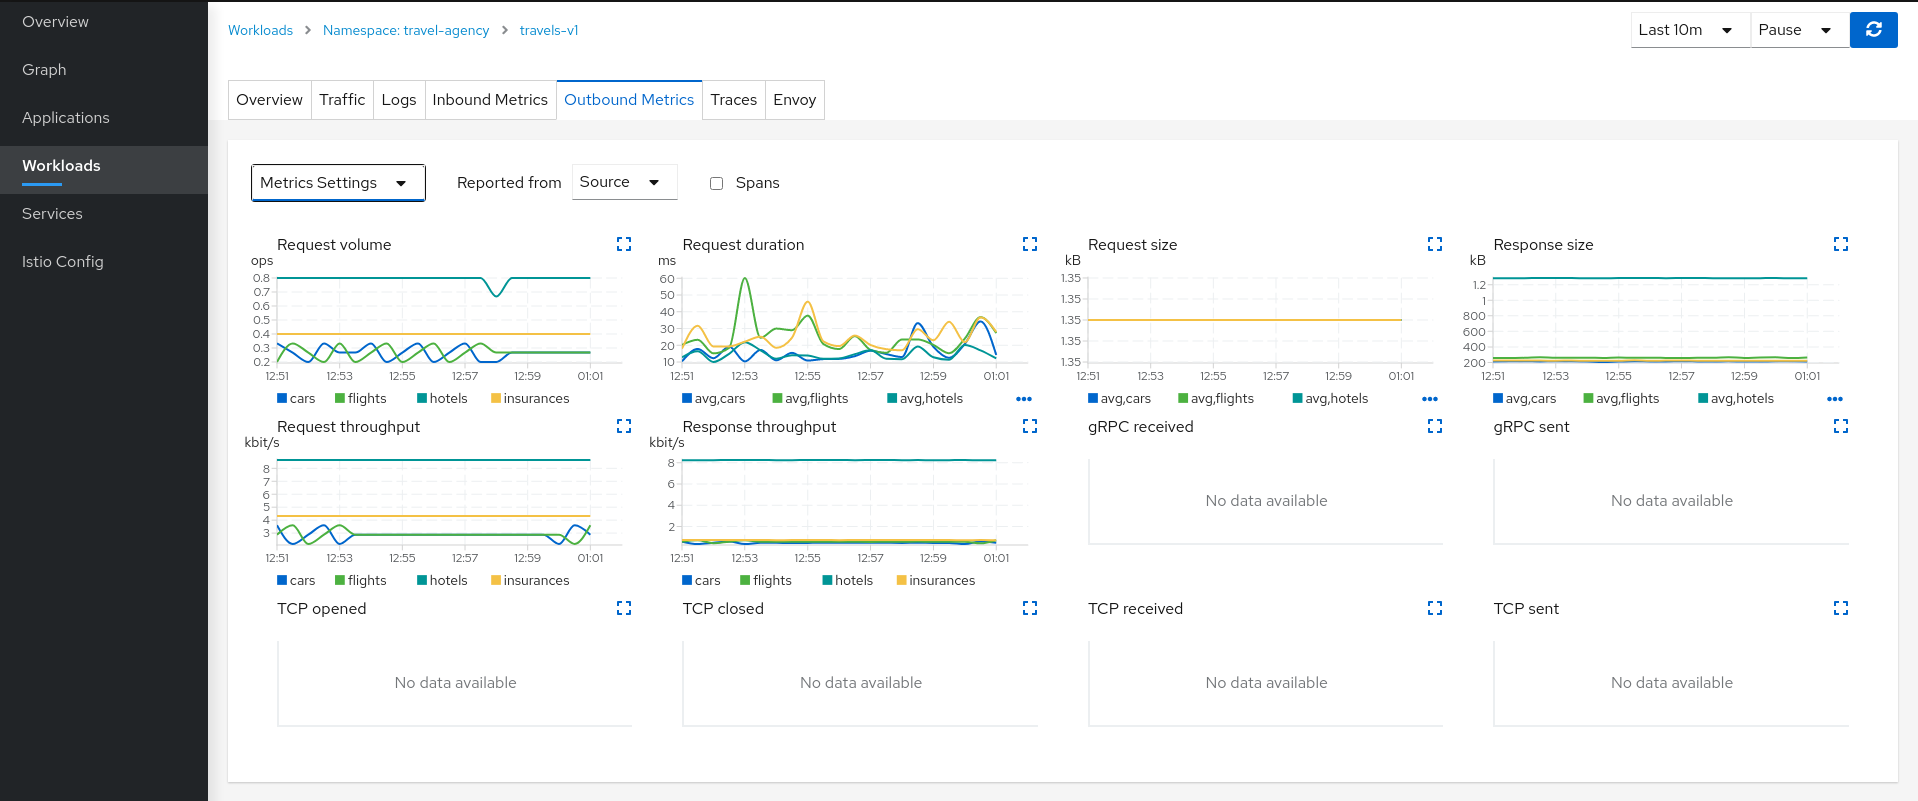
The metrics tab shows charts built from Istio proxy telemetry. Expand the Request volume chart for a closer look:
Use Metrics Settings to change grouping and aggregation. Enable the spans checkbox to correlate metrics with tracing spans in the same chart.
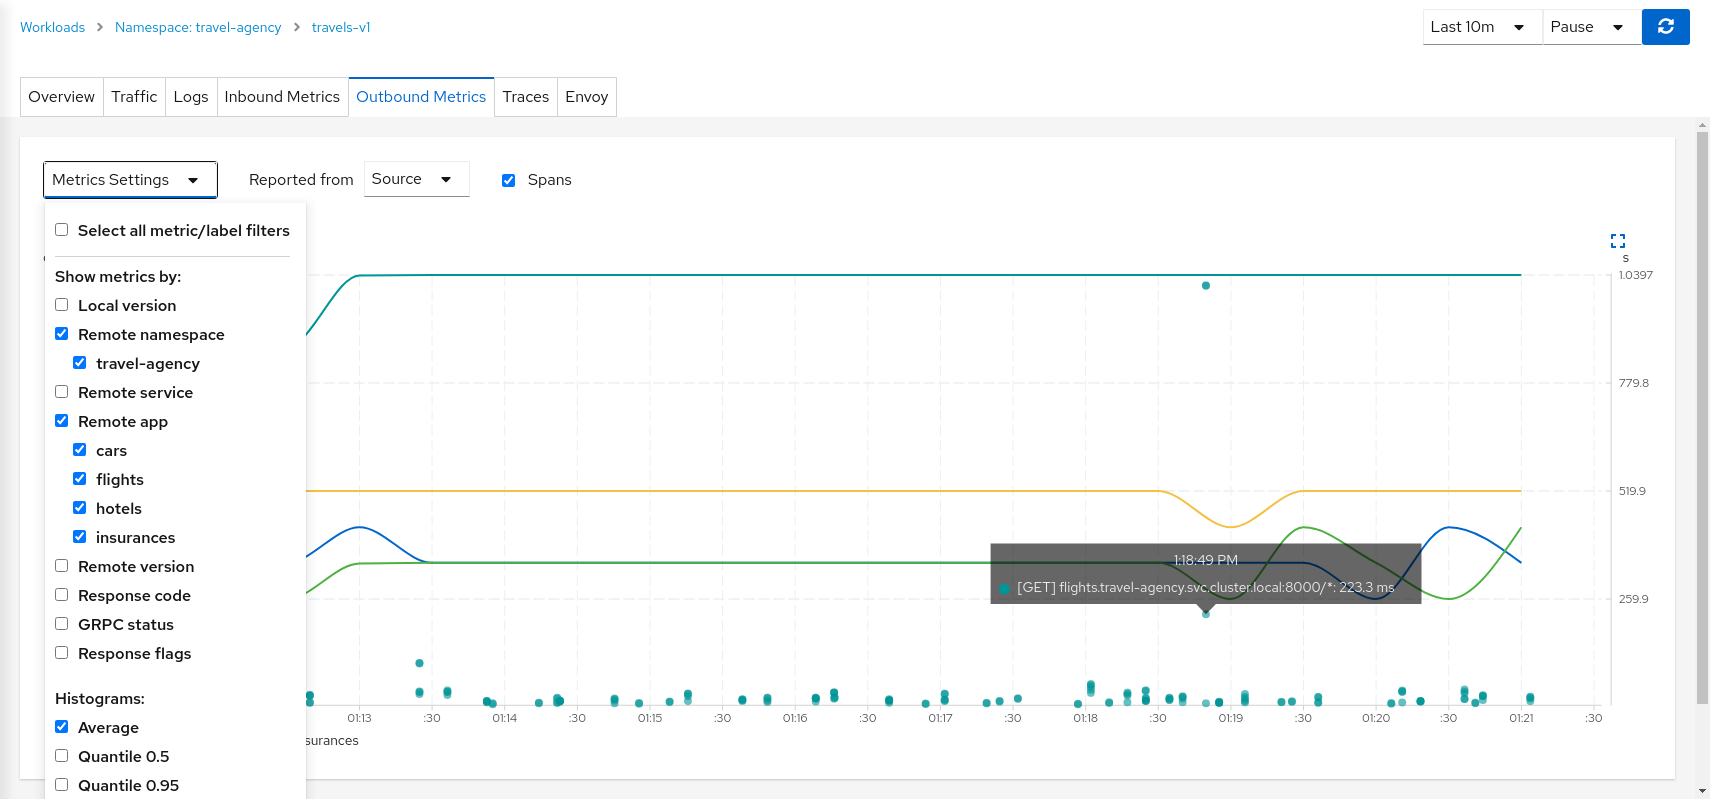
In the context of the travels application, hotels request volume is higher than the other travel-agency services. Request duration looks normal, so the asymmetry is likely part of the application business logic rather than a performance problem.
Step 3
Review Logs for travels-v1The Logs tab combines application container logs with Istio sidecar proxy logs. Enable spans for a correlated view of logs and traces.
Two main business methods appear in the application logs: GetDestinations and GetTravelQuote.
GetDestinations issues a GET /hotels request without parameters (visible in the sidecar proxy log):
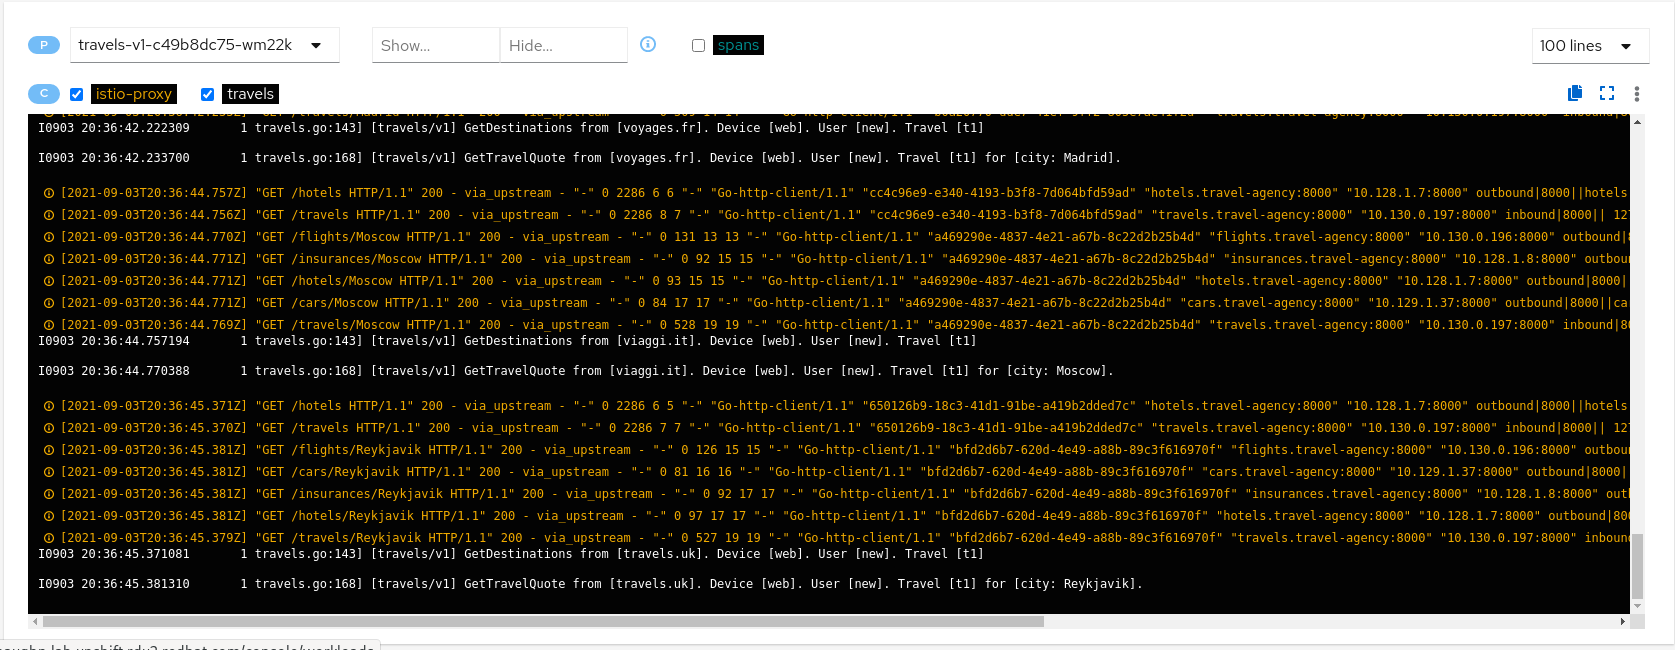
GetTravelQuote calls multiple downstream services with a specific city parameter:

As described in the Travel Demo design, an initial query returns available hotels before the user selects a destination and requests quotes from the other services — which explains the higher hotels utilization.
Step 4
Review Traces for travels-v1The hotels service handles more traffic than other travel-agency services. Next, use traces to see whether any step is slower than expected.
Open the Traces tab on travels-v1. Compare individual traces with the metrics histogram to judge whether a spike is unusual relative to average latency.
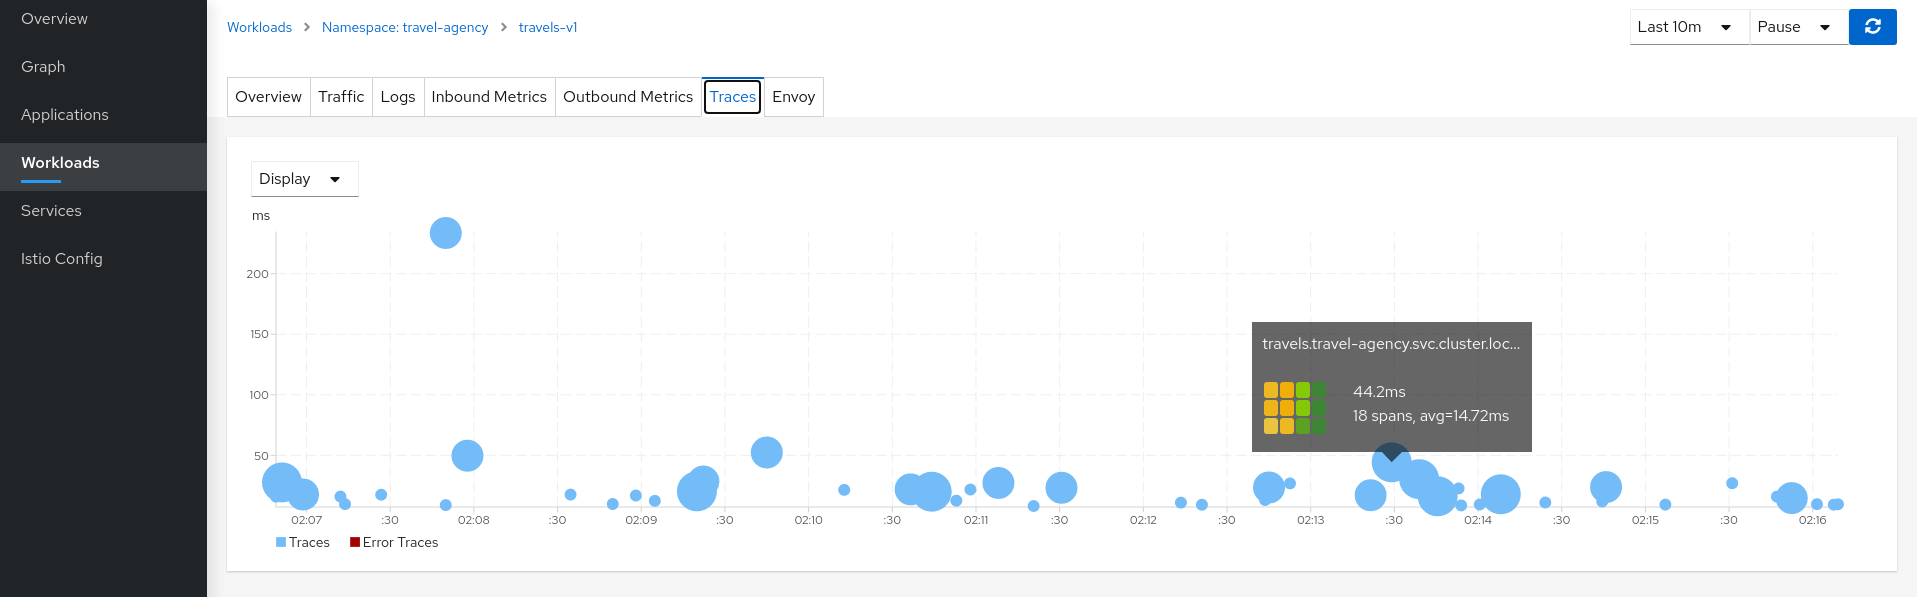
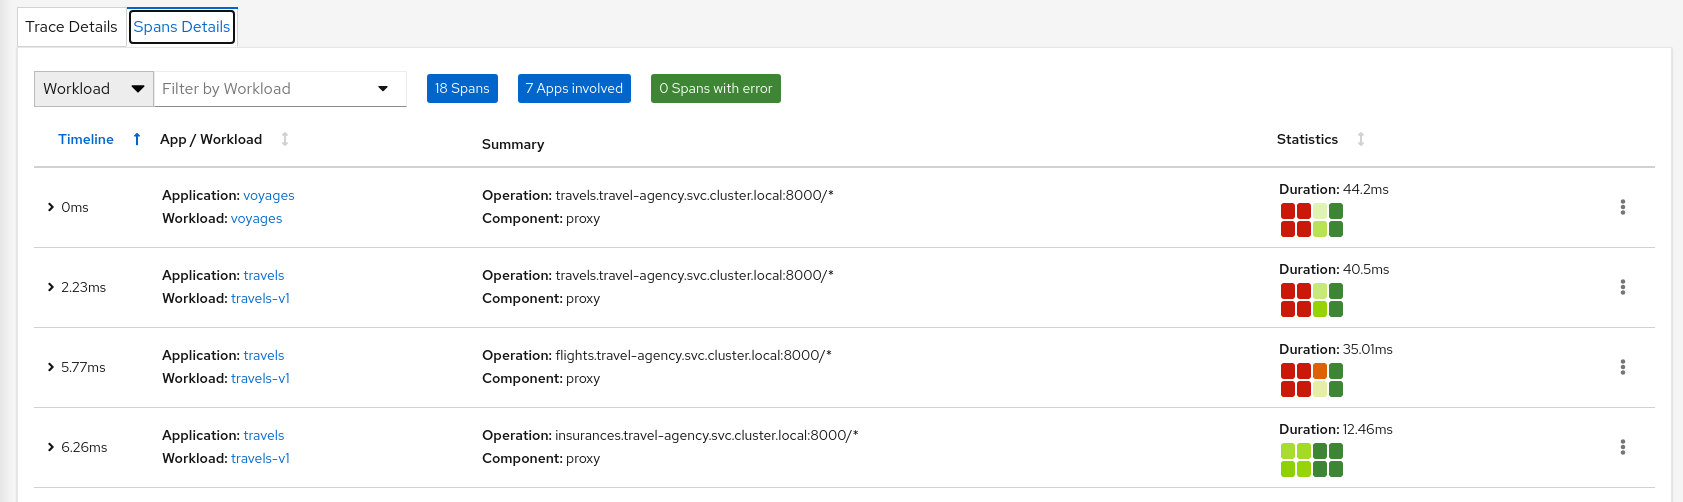
Click an interesting trace to see the trace details. Individual spans can be compared in more detail to pinpoint a slow step in a larger request flow.
Explore Further
This chapter focused on the graph and on the travels-v1 workload detail. The same observability tools are available throughout Kiali — browse the list pages and open any component to explore its detail view.
- Namespaces — open travel-portal or travel-agency for namespace health and shortcuts to filtered list views.
- Applications — compare travels in travel-agency with portal apps such as viaggi or voyages.
- Services — inspect hotels, which carried more load in the graph walkthrough.
- Workloads — open hotels-v1 or a portal workload and review the same tabs used here.
- Istio Config — browse VirtualServices, DestinationRules, and other Istio objects with validation and YAML.
Each detail page starts with an Overview tab (mini-graph, health, and links to related objects). Applications, services, and workloads also provide Traffic, Metrics, and Traces tabs. Workloads add Logs and Envoy, as you saw on travels-v1.
See Detail Views for a full description of each tab.
When you are ready to change mesh behavior — not only observe it — continue to Control the Mesh, where Kiali wizards help configure request routing and other traffic management scenarios.