Performance and Scalability
What are some Tips for working with a large mesh?
It can be an observability challenge to work with a large mesh. Here are a few things that can be done to improve the situation.
Resources and Connectivity
Before talking about Kiali features, it is important to understand that Kiali’s performance is dependent on the performance and responsiveness of your metrics database (typically Prometheus), and your tracing store, for installations using tracing. For Prometheus scalability tips, see Prometheus Tuning. See Tempo Tuning if using Tempo for your trace store.
Only when query performance for metrics and traces is good, can Kiali respond in a reasonable way. So, it is also important to provide sufficient connectivity for the API calls to return information in a timely way.
Manual Refresh
By default, Kiali will immediately attempt to populate the page, the default being the Overview page. After the initial page is rendered, most pages will automatically refresh, based on the setting in the “Refresh Interval” dropdown. The default is every 60s. For a large mesh, even the initial page load can be slow, and it can be frustrating if you have to wait for the page to render before being able to enter desired options and/or filters, and then ask for another refresh.
In the dropdown, Kiali offers the “Manual” refresh setting. If selected, Kiali will not refresh the page on a timer. Kiali also offers a “Pause” setting. “Pause” also prevents a timed refresh, but it will refresh on an option or filter change. “Manual” will only refresh on a manual click of the refresh button. To ensure that even the initial page load is avoided, the default can be set in the Kiali CR:spec.kiali_feature_flags.ui_defaults.refresh_interval: manual. With this setting it is possible to “batch” settings changes. For example, when working with the graph you could choose namespaces, update Display settings, and also change Traffic settings, all before rendering the graph.
URL Bookmarks
Kiali pages store most, if not all, of their settings as URL query parameters. So, it can be useful to bookmark pages you’ve configured with desired options and filters. By visiting the bookmarked page those options and filters will be applied immediately.
Large Graphs
Working with large graphs is difficult. A graph does not have to be very large before it becomes complicated and/or dense. Here are a few suggestions.
Tips to reduce graph size and speed up generation
- Limit the namespaces selected.
- Each requested namespace is like its own graph request, and then each resulting namespace graph is “stitched” together.
- This may not be possible, in some mesh designs even a single namespace is very populated.
- Reduce the protocols selected
- Using the Traffic dropdown, only fetch TCP or HTTP, not both. Different queries are performed for the different protocols.
- In Ambient, you can also choose between ztunnel and waypoint telemetry. This can reduce the number of queries and/or the size of your graph.
- Prefer smaller Duration dropdown values.
- The larger the duration, the more metric data that must be processed.
- Enable response time edge labels only after minimizing the size of your graph.
- This requires extra queries against Prometheus histograms, and can be expensive.
- Enable the Security Display option only after minimizing the size of your graph.
- This requires extra Prometheus queries.
- Disable the Service Nodes Display option, if not needed.
- This is enabled by default, and provides valuable routing information, but it does also add extra nodes and edges.
- Disable the Virtual Services Display option, if not needed.
- This will take away some of the graph decoration but stops the need to interact with k8s API/objects, which can be heavy.
- Prefer workload graph type
- This graph type often renders more quickly than other graph types.
- Only enable Operation Nodes as needed.
- This option is very valuable when using request classification, but does require extra queries, and does add extra nodes and edges.
Tips for manipulating your graph
After your graph is generated and rendered in the UI, there are client-side ways to improve your visualization:
- Graph Find and Hide
- Find and Hide are very valuable tools. Both use the same simple query language, described in detail in the on-screen help (click the info icon next to the inputs, on the toolbar). It is highly recommended to become familiar with this feature, very simple expressions can be useful.
- Find will highlight the nodes and edges that match the expression. This can help locate nodes and edges in a large graph (or even a small graph).
- Hide will temporarily remove the matching nodes and edges. This can effectively clean up a large graph into a very focused view.
- It is possible to pre-define Find and Hide expressions in your Kiali CR. These pre-defined expressions can even be configured to be applied automatically.
- For more, see find_options and hide_options in the Kiali CR Reference.
- Layouts
- Kiali provides multiple layouts. Many graphs looks best using the default layout, but others may improve using a different layout.
- Layouts are available by clicking the on-screen icons at the bottom of the graph.
Mini-Graphs
One way to avoid a large graph is to avoid it completely. Instead, navigate to a specific object of interest. The detail page offers a mini-graph, centered on the specific service, app or workload. Clicking a node on the mini-graph navigates to that node’s detail page. Mini-graphs tend to generate quickly because they are much more specific than a namespace graph. You can also navigate from the mini-graph back to the main graph, or a node graph. The node graph is similar to the mini-graph but offers all of the main graph options.
Graph Caching
Graph caching was added starting with Kiali v2.21. It caches, with background re-compute, the most recent namespace graph per session. The initial graph is generated synchonously, and is placed in the cache. Due to the vast number of options, there is no easy way to pre-compute the initial graph before it is requested by the user. The graph will then be re-computed in the background with a frequency related to the refresh interval set by the user on the graph page. The larger the interval the less often the graph is re-computed. Subsequent requests for the same graph will return the most recently computed cache entry, and so it should return quickly. The cache entry is evicted if the graph options change, or if the cache is not hit for the configured “inactivity_timeout” duration. This allows a user to navigate away in the UI, and when returning to the graph find that it is ready and updated.
A few notes:
- Different tabs in the same browser, for the same user, share a session and therefore a cache entry.
- Anonymous login strategy is session-less. and so all anonymous logins share a cache entry.
- This feature is considered beta-level, and it’s configuration is not yet part of the CRD schema. Here is the relevant configuration, with the default settings:
spec:
  kiali_internal:
    graph_cache:
      enabled: true
      inactivity_timeout: "10m"
      max_cache_memory_mb: 1000
      refresh_interval: "60s"
What performance and scalability measurements are done?
Performance tests are conducted on setups with 10, 50, 200, 300, 500, and 800 namespaces. Each namespace contains:
- 1 Service
- 2 Workloads
- 2 Istio configurations
What improvements have been made to Kiali’s performance in recent versions?
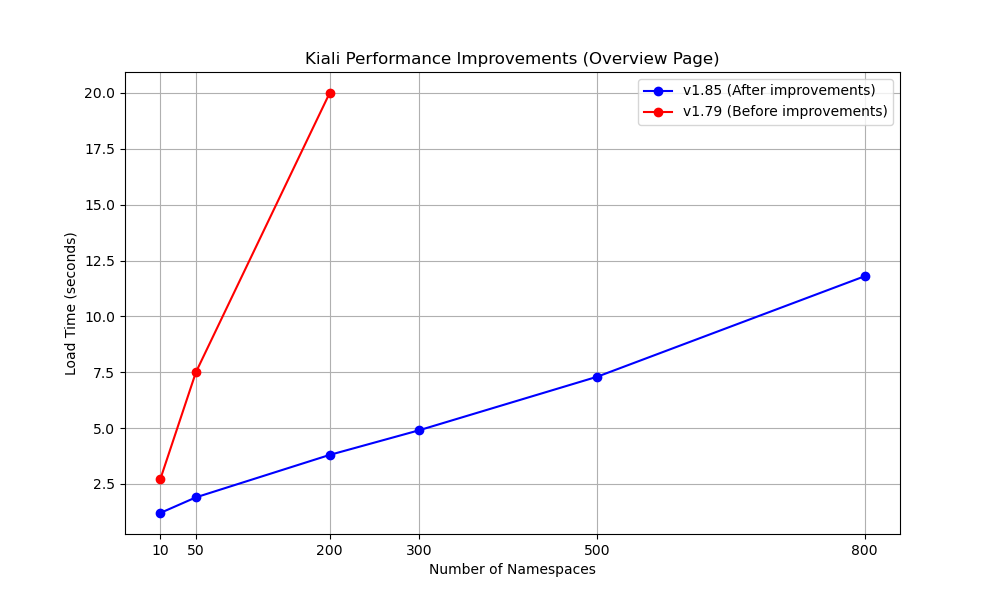
Performance data is collected using automated performance tests on various setups, ensuring a comprehensive evaluation of improvements. Since the release of Kiali v1.80, significant performance enhancements have been implemented, resulting in up to a 5x improvement in page load times. The performance improvements were achieved by reducing the number of requests made from the Kiali UI to the services. Instead of multiple requests, the process was streamlined to unify these into a single request per cluster. The enhanced performance significantly reduces the time users spend waiting for pages to load, leading to a more efficient and smooth user experience.
Performance Improvements Matrix Per Kiali Version And Section
Kiali |
Section |
Improvements |
|---|---|---|
| 1.80 | Graph Page | Validations |
| 1.81 | Overview Page | mTLS, Metrics, Health |
| 1.82 | Applications List | Overall loading |
| 1.83 | Workloads List, Services List | Overall loading |
These improvements make Kiali more responsive and efficient, particularly in environments with a large number of namespaces, services, and workloads, enhancing usability and productivity.
For a graphical representation of the performance improvements between Kiali v1.79 (before improvements) and v1.85 (after improvements) of the Overview page load times, refer to the chart below: