Distributed Tracing
How to know which is the URL for Jaeger or Tempo?
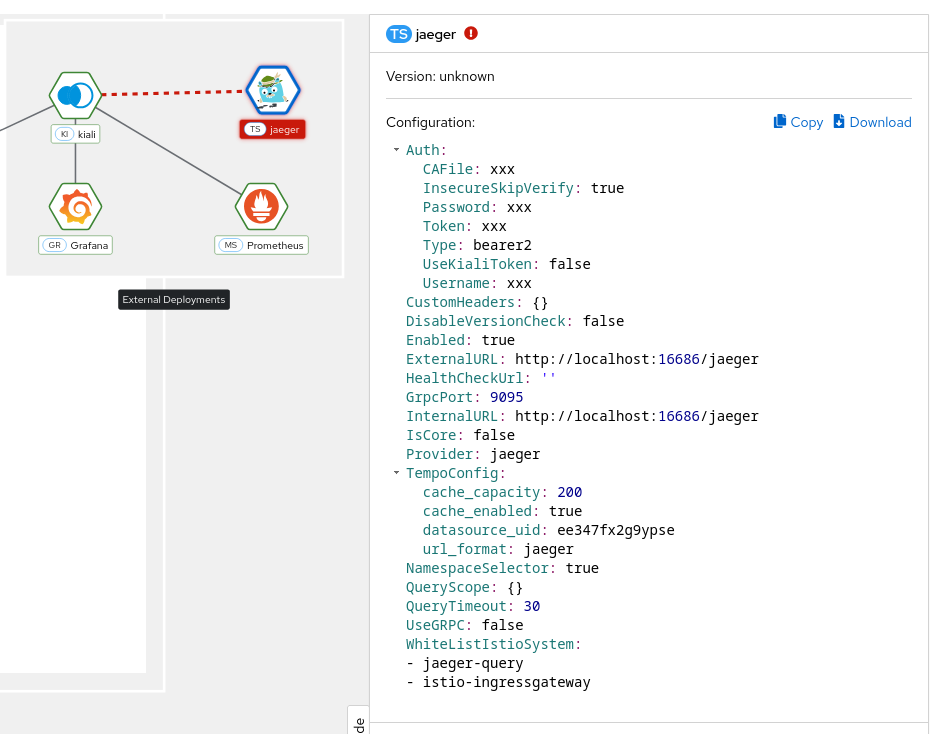
From Kiali 2.11, a new tracing tool in the Mesh page is provided to help troubleshooting and provide possible valid tracing configurations.
Why is Jaeger unreachable or Kiali showing the error “Could not fetch traces”?
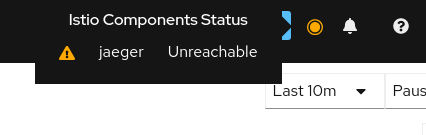
Istio components status indicator shows “Jaeger unreachable”:
While on any Tracing page, error “Could not fetch traces” is displayed:
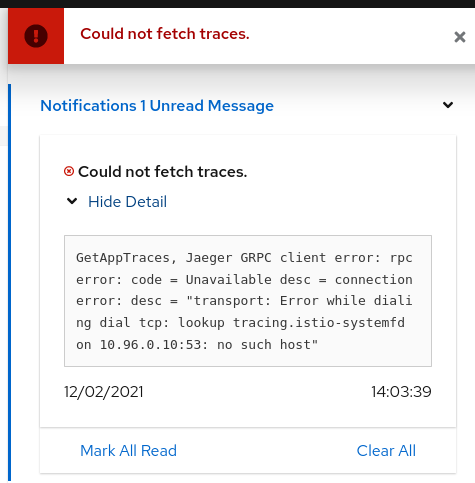
Apparently, Kiali is unable to connect to Jaeger. Make sure tracing is correctly configured in the Kiali CR.
      tracing:
        auth:
          type: none
        enabled: true
        internal_url: 'http://tracing.istio-system/jaeger'
        external_url: 'http://jaeger.example.com/'
        use_grpc: true
You need especially to pay attention to the internal_url field, which is how Kiali backend contacts the Jaeger service. In general, this URL is written using Kubernetes domain names in the form of http://service.namespace, plus a path.
If you’re not sure about this URL, try to find your Jaeger service and its exposed ports:
$ kubectl get services -n istio-system
...
tracing      ClusterIP      10.108.216.102   <none>        80/TCP      47m
...
To validate this URL, you can try to curl its API via Kiali pod, by appending /api/traces to the configured URL (in the following, replace with the appropriate Kiali pod):
$ kubectl exec -n istio-system -it kiali-556fdb8ff5-p6l2n -- curl http://tracing.istio-system/jaeger/api/traces

{"data":null,"total":0,"limit":0,"offset":0,"errors":[{"code":400,"msg":"parameter 'service' is required"}]}
If you see some returning JSON as in the above example, that should be the URL that you must configure.
If instead of that you see some blocks of mixed HTML/Javascript mentioning JaegerUI, then probably the host+port are correct but the path isn’t.
A common mistake is to forget the /jaeger suffix, which is often used in Jaeger deployments.
It may also happen that you have a service named jaeger-query, exposing port 16686, instead of the more common tracing service on port 80. In that situation, set internal_url to http://jaeger-query.istio-system:16686/jaeger.
If Jaeger needs an authentication, make sure to correctly configure the auth section.
Note that in general, Kiali will connect to Jaeger via GRPC, which provides better performances. If for some reason it cannot be done (e.g. Jaeger being behind a reverse-proxy that doesn’t support GRPC, or that needs more configuration in that purpose), it is possible to switch back to using the http/json API of Jaeger by setting use_grpc to false.
If for some reason the GRPC connection fails and you think it shouldn’t (e.g. your reverse-proxy supports it, and the non-grpc config works fine), please get in touch with us.
Why can’t I see any external link to Jaeger?
In addition to the embedded integration that Kiali provides with Jaeger, it is possible to show external links to the Jaeger UI. To do so, the external URL must be configured in the Kiali CR.
    tracing:
      # ...
      external_url: "http://jaeger.example.com/"
When configured, this URL will be used to generate a couple of links to Jaeger within Kiali. It’s also visible in the Mesh page:
Why do I see an external link instead of Kiali’s own Tracing page?
On the Application detail page, the Traces tab might redirect to Jaeger via an external link instead of showing the Kiali Tracing view. It happens when you have the external_url field configured, but not internal_url, which means the Kiali backend will not be able to connect to Jaeger.
To fix it, configure internal_url in the Kiali CR.
Why do I see “Missing root span” for the root span of some span details on Traces tab?
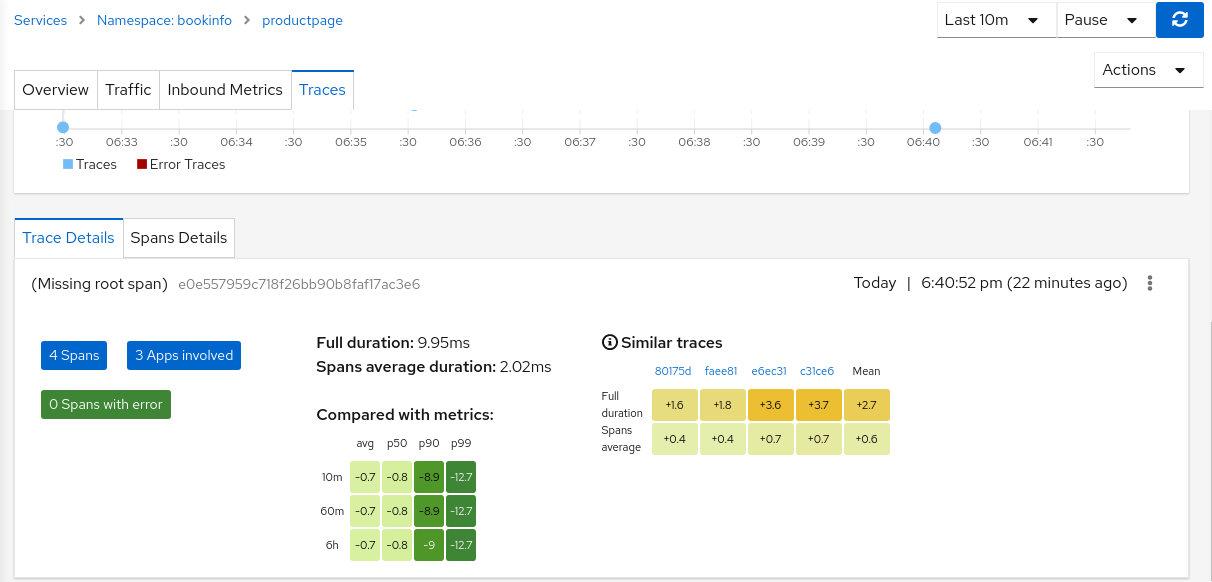
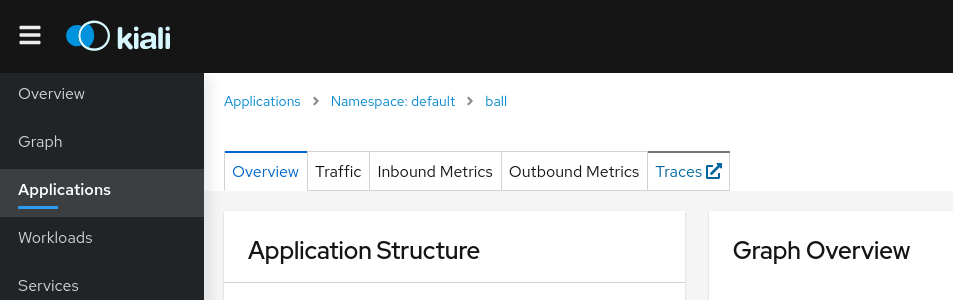
In Traces tab, while clicking on a trace, it shows the details of that trace and information about spans. These details also include the root span information. But for the traces for traffic that is not comming from ingress-gateway, the root span information is not available in Jaeger, thus Kiali is displaying “Missing root span” for those traces’ details and tooltips in Traces tab and in Graph pages.
Why do I see “error reading server preface: http2: frame too large” error when Kiali is not able to fetch Traces?
Sometimes this error can occur when there is a problem in the configuration and there is an http URL configured but Kiali is configured to use grpc. For example:
use_grpc: true
internal_url: "http://jaeger_url:16686/jaeger"
That should be solved when use_grpc: false or using the grpc port internal_url: "http://jaeger_url:16685/jaeger"
Why do I see “[gRPC Tempo] GetAppTraces, Tracing gRPC client error: rpc error” error when Kiali is not able to fetch Traces in Tempo?
This error can occur when use_grpc is true, but the port is not open/accessible.
Why do I see “invalid character ‘p’ after top-level value” error when Kiali is not able to fetch Traces in Tempo?
The Tempo URL is set in internal_url, but the configuration in Kiali CR for external_services.tracing.provider is not tempo.
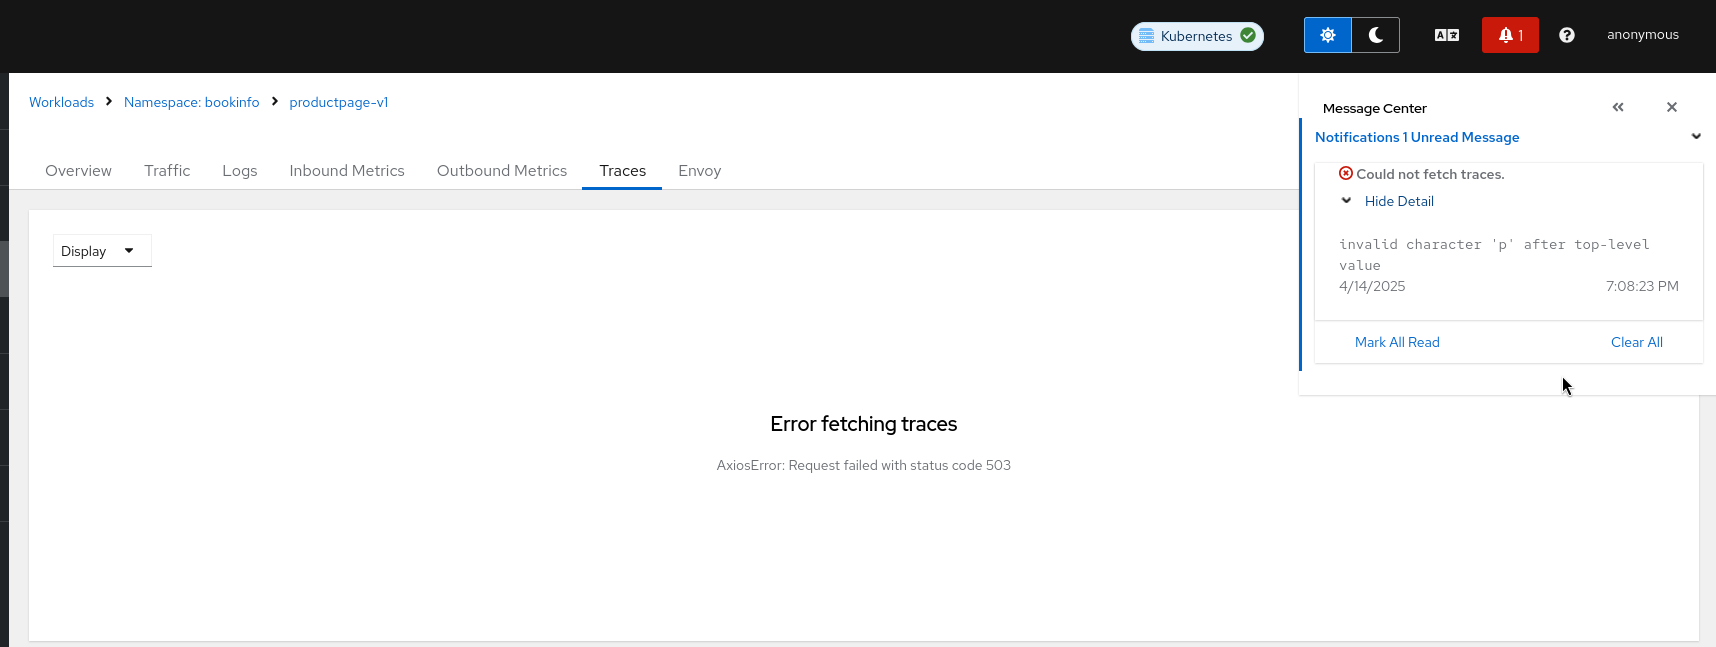
Why do I see “Error fetching traces. AxiosError: Request failed with status code 503” error when Kiali is not able to fetch Traces from Tempo?
This error can occur for several reasons, but it usually means that the internal URL is not the right Tracing API.
Note that Grafana Tempo can also expose a Jaeger API, but the right url needs to be set in the Kiali CR pointing to the Jaeger endpoint.
If that is not the issue, here there are some troubleshooting steps:
- Expand the messages icon to find more information about the error.
- In the Mesh page, check that the tracing provider is reachable.
- In the Mesh page, check the configuration for the tracing provider. Verify the URLs are correct.
- Verify the provider (jaeger/tempo) matches the internal/external URL that is configured.
- Review the Kiali logs and check for specific tracing errors. Might be helpful to set the log level to
debug. - When the log level is set to debug, Kiali will log the complete trace query. It might be useful to test it from a cURL to verify if that is reachable from the Kiali pod and it has results.
Sometimes Tempo is configured outside the Kiali namespace, so there might be additional issues like reachability, certificates setup, etc.
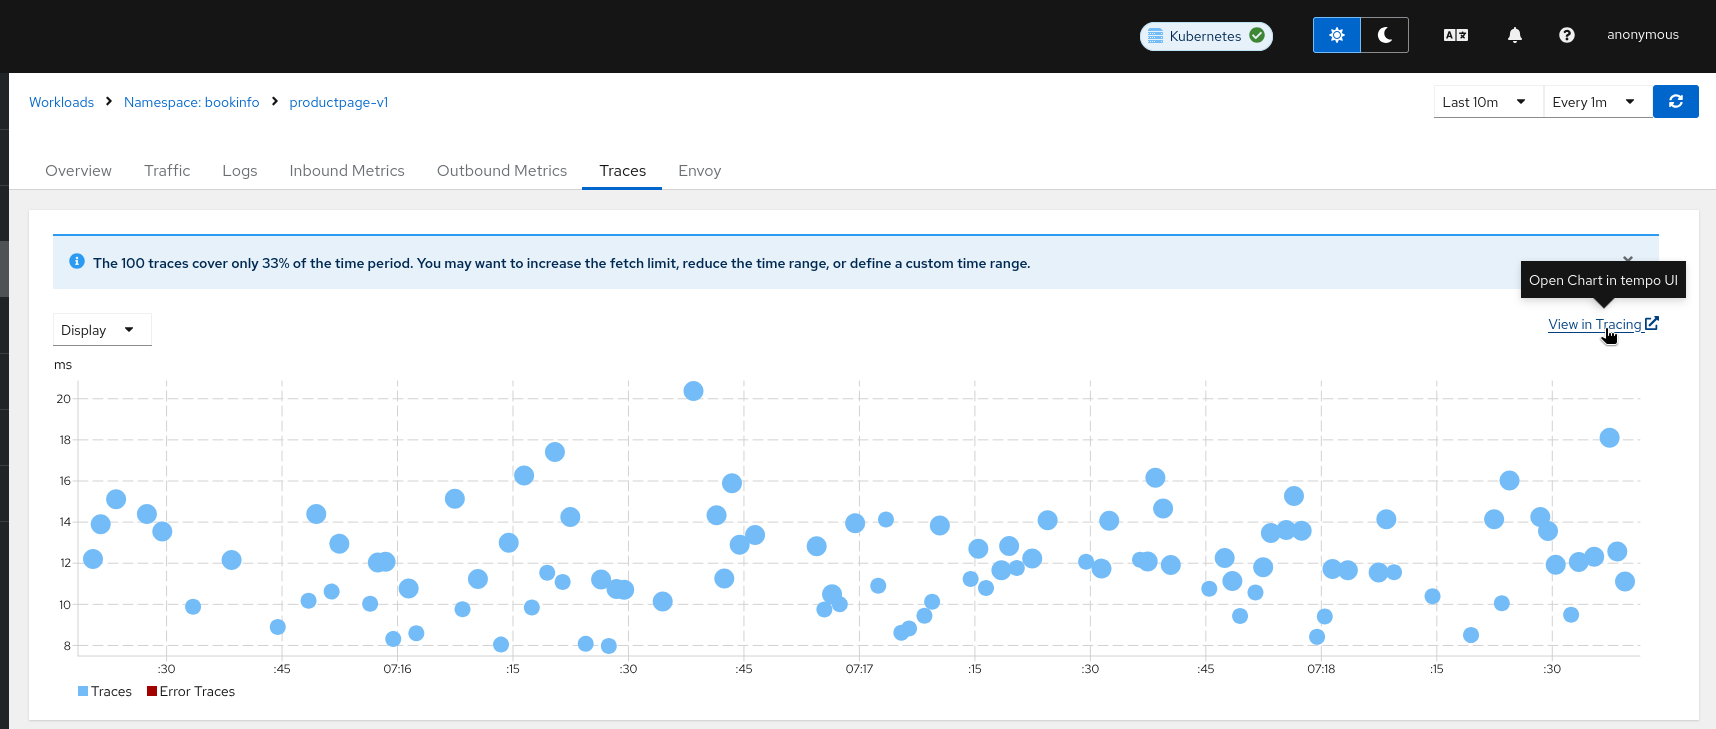
Why can’t I see the link “View in Tracing” when using Tempo?
Some settings need to be configured in order to enable the external_url.
When tempo is set in the Kiali CR external_services.tracing.provider, the default url_format is grafana, and external_services.tracing.external_url needs to be set accordingly.
tracing:
  provider: "tempo"
  external_url: "http://external-grafana-url"
  tempo_config:
    url_format: "grafana"
When url_format is set to jaeger, the external_services.tracing.external_url needs to be set as well:
tracing:
  provider: "tempo"
  external_url: "https://tempo-tempo-query-frontend-tempo.apps-crc.testing/"
  tempo_config:
    url_format: "jaeger"
When url_format is set to openshift, there are additional parameters to set:
tracing:
  provider: "tempo"
  external_url: "https://console-openshift-console.apps-crc.testing/"
  tempo_config:
    name: "sample"
    namespace: "tempo"
    tenant: "default"
    url_format: "openshift"
Where:
- name: is the name of the Tempo instance
- namespace where the Tempo instance is installed
- tenant: The tenant name where the traces are sent
For OSSMC, when the tracing plugin is enabled, it will redirect automatically to the Tracing UI plugin.
Why can’t I see traces and there are no errors?
First thing to verify will be if Istio is correctly configured to send traces and verify in the Tracing backend if traces do exist.
If the tracing is configured correctly, verify in the tracing backend if there are traces for the services in the Mesh that you are expecting to have traces.
By default, Kiali will search for the service name using service.namespace, but if the traces are create within the namespace selector, the following CR setting should be changed:
tracing:
  namespace_selector: false
For further Tempo configuration options, take a look at the Tempo configuration page
How do I modify the trace limit?
The trace limit can be changed from the UI, and it is available as a Display menu option:
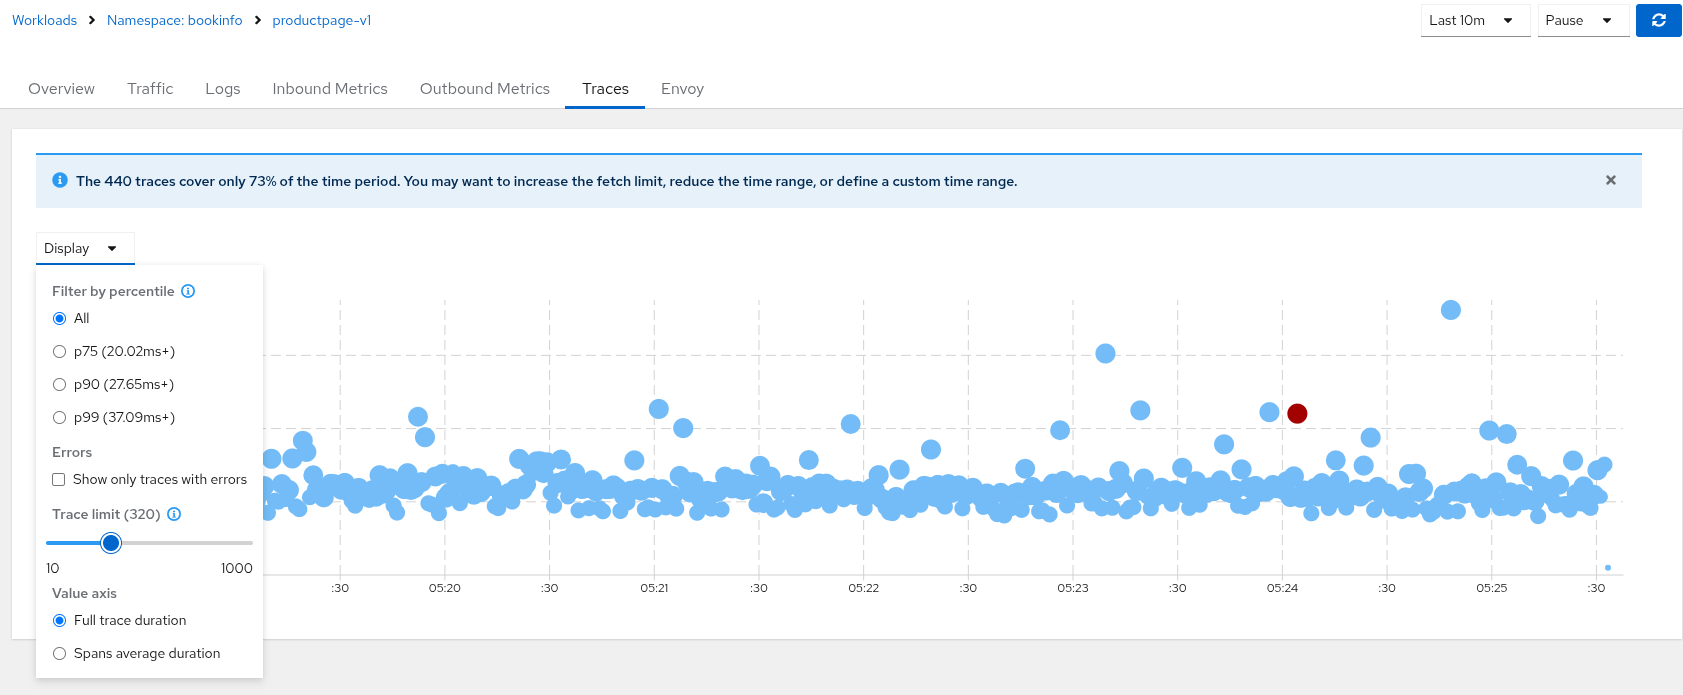
The default value (Set to 100) can be modified in the Kiali CR setting kiali_feature_flags.ui_defaults.tracing.limit.
Why do I see a Jaeger gRPC client error: i/o timeout?
If you are using Tempo Operator 0.20, there is a bug where the gRPC port is closed and Kiali shows an error like:
Could not fetch traces.
GetAppTraces, Jaeger GRPC client error: rpc error: code = Unavailable desc = connection error: desc = "transport: Error while dialing: dial tcp 172.30.14.34:16685: i/o timeout"
Other common causes are that the gRPC port is not exposed by the tracing Service, is blocked by a NetworkPolicy/firewall, or that internal_url is pointing to the wrong host/port.