Debugging Kiali
Logs
The most basic way of debugging the internals of Kiali is to examine its log messages. A typical way of examining the log messages is via:
kubectl logs -n istio-system deployment/kiali
Each log message is logged at a specific level. The different log levels are trace, debug, info, warn, error, and fatal. By default, log messages at info level and higher will be logged. If you want to see more verbose logs, set the log level to debug or trace (trace is the most verbose setting and will make the log output very “noisy”). You set the log level in the Kiali CR:
spec:
  deployment:
    logger:
      log_level: debug
By default, Kiali will log messages in a basic text format. You can have Kiali log messages in JSON format, which can sometimes make reading, querying, and filtering the logs easier:
spec:
  deployment:
    logger:
      log_format: json
Filtering logs
You may want to pinpoint specific log messages in the Kiali logs. The following are different commands and expressions you can use in order to filter the logs to help expose messages you are most interested in. There are two sets of commands/expressions documented below: one using grep and sed if Kiali is logging its messages in simple text format, and the other using jq if Kiali is logging its messages in JSON format. (Note that jq will format each JSON message into multiple lines to read the JSON easier. Pass the -c option to jq to condense the JSON into one line per log message - it may be harder to read, but will reduce the amount of lines considerably.)
Note that all commands/expressions below should have the Kiali logs piped into its stdin. Usually this means using kubectl to get the logs from Kiali and pipe them, like this:
kubectl logs -n istio-system deployments/kiali | <...commands/expressions here...>
Remove log levels
If you have enabled the log level of “trace”, the Kiali logs will contain a large amount of messages. If you have a hard time sifting through all of those messages, rather than reconfigure Kiali with a different log level you can simply filter out the trace messages.
| text: | grep -v ' TRC ' |
| json: | jq -R 'fromjson? | select(.level != "trace")' |
If you want to remove both “trace” and “debug” level messages (leaving “info” and higher priority messages):
| text: | grep -vE ' (TRC|DBG) ' |
| json: | jq -R 'fromjson? | select(.level != "trace" and .level != "debug")' |
Show logs for only a single request
Some log messages are associated with a single, specific request. You can obtain all the logs associated with any specific request given a request ID. To determine which request ID you want to use as a filter, you first find all the request IDs in the logs:
| text: | grep -o 'request-id=[^ ]*' | sed 's/^request-id=//' | sort -u |
| json: | jq -rR 'fromjson? | select(has("request-id")) | ."request-id"' |
Pick a request ID, and use it to retrieve all the logs associated with that request:
| text: | grep 'request-id=abc123' |
| json: | jq -rR 'fromjson? | select(."request-id" == "abc123")' |
But just having a list of every request ID is likely not enough. You most likely want to look at the logs for requests for a specific Kiali API (like the graph generation API). To see all the different routes into the Kiali API server that were requested, you can get their route names like this:
| text: | grep -o 'route=[^ ]*' | sed 's/^route=//' | sort -u |
| json: | jq -rR 'fromjson? | select(.route) | .route' | sort -u |
The GraphNamespaces route is an important one - it is the API that is used to generate the main Kiali graphs. If you want to see all the IDs for all requests to this API, you can do this:
| text: | grep 'route=GraphNamespaces' | grep -o 'request-id=[^ ]*' | sed 's/^request-id=//' | sort -u |
| json: | jq -rR 'fromjson? | select(.route == "GraphNamespaces") | .["request-id"]' | sort -u |
Now you can take one of those request IDs and obtain logs for it (as explained earlier) to see all the logs for that request to generate a graph.
Some routes that may be of interest are:
AggregateMetrics: aggregate metrics for a given resourceAppMetrics,ServiceMetrics,WorkloadMetrics: gets metrics for a given resourceAppSpans,ServiceSpans,WorkloadSpans: gets tracing spans for a given resourceAppTraces,ServiceTraces,WorkloadTraces: gets traces for a given resourceAuthenticate: authenticates usersClustersHealth: gets the health data for all resources in a namespace within a single clusterConfigValidationSummary: gets the validation summary for all resources in given namespacesControlPlaneMetrics: gets metrics for a single control planeGraphAggregate: generates a node detail graphGraphNamespaces: generates a namespaces graphIstioConfigDetails: gets the content of an Istio configuration resourceIstioConfigList: gets the list of Istio configuration resources in a namespaceMeshGraph: generates a mesh graphNamespaceList: gets the list of available namespacesNamespaceMetrics: gets metrics for a single namespaceNamespaceValidationSummary: gets the validation summary for all resources in a given namespaceTracesDetails: gets detailed information on a specific trace
Show logs of processing times
Kiali collects metrics of its internal systems to track its performance (see the next section, “Metrics”). Many of these metrics use a timer to measure the duration of time that Kiali takes to process some unit of work (for example, the time it takes to generate a graph). Kiali will log these duration times as well as export them to Prometheus. To see what metric timers Kiali is tracking internally, you can do this:
| text: | grep -o 'timer=[^ ]*' | sed 's/^timer=//' | sort -u |
| json: | jq -rR 'fromjson? | select(.timer) | .timer' | sort -u |
Note that Kiali will not log times that are under 3 seconds since those are deemed uninteresting and logging them will make the logs “noisy”. Prometheus will still collect those metrics, so they are still being recorded.
One timer is especially useful - the timer named “GraphGenerationTime”. You can query the log for all the graph generation times like this:
| text: | grep 'timer=GraphGenerationTime' |
| json: | jq -R 'fromjson? | select(.timer == "GraphGenerationTime")' |
Each log message contains a duration attribute - this is the amount of time it took to generate the graph (or parts of the graph). Look at the additional attributes for details on what the timer measured.
Some timers that may be of interest are:
APIProcessingTime: The time it takes to process an API request in its entiretyCheckerProcessingTime: The time it takes to run a specific validation checkerGraphAppenderTime: The time it takes for an appender to decorate a graphGraphGenerationTime: The time it takes to generate a full graphPrometheusProcessingTime: The time it takes to run Prometheus queriesSingleValidationProcessingTime: The time it takes to validate an Istio configuration resourceTracingProcessingTime: The time it takes to run Tracing queriesValidationProcessingTime: The time it takes to validate a set of Istio configuration resources
Metrics
Kiali has a metrics endpoint that can be enabled, allowing Prometheus to collect Kiali metrics. You can then use Prometheus (or Kiali itself) to examine and analyze these metrics.
The metrics server uses the same TLS configuration as the main Kiali server. When TLS is enabled (via identity.cert_file and identity.private_key_file), the metrics endpoint requires HTTPS and enforces the same TLS policy (versions and cipher suites). When TLS is not configured, the metrics endpoint uses plain HTTP.
Configuring Prometheus to Scrape Kiali Metrics
When Kiali’s metrics endpoint is enabled, the Kiali pod includes standard prometheus.io/* annotations that many Prometheus deployments use for auto-discovery:
prometheus.io/scrape: "true"prometheus.io/port: "<metrics-port>"(default: 9090)prometheus.io/scheme: "http"or"https"(depending on TLS configuration)
For HTTP (no TLS configured): If your Prometheus setup is configured to honor prometheus.io/* pod annotations (for example, the standard kubernetes-pods scrape job), it can scrape Kiali metrics without additional configuration. If you’re using Prometheus Operator and do not have a pod-annotation scrape job, create a PodMonitor or ServiceMonitor instead.
For HTTPS (TLS configured): When TLS is enabled, Prometheus needs additional configuration to properly scrape the metrics endpoint. This is particularly relevant on OpenShift where Kiali automatically uses service-serving certificates.
The challenge is that service-serving certificates are valid for the Service DNS name (e.g., kiali.istio-system.svc), not for pod IP addresses. When Prometheus scrapes pods directly by IP address (as the standard kubernetes-pods job does), TLS certificate validation fails. The solutions below address this by ensuring Prometheus uses the Service DNS name for TLS validation, even when the actual scrape target is a pod IP.
Option 1: ServiceMonitor (Prometheus Operator)
If you’re using the Prometheus Operator, create a ServiceMonitor that scrapes through the Kiali Service (where the certificate is valid):
apiVersion: monitoring.coreos.com/v1
kind: ServiceMonitor
metadata:
  name: kiali
  namespace: istio-system  # Or your Kiali namespace
spec:
  endpoints:
  - port: tcp-metrics
    scheme: https
    tlsConfig:
      # For OpenShift cluster monitoring, the service CA is available at this path
      caFile: /etc/prometheus/configmaps/serving-certs-ca-bundle/service-ca.crt
      # serverName must match the certificate's SAN
      serverName: kiali.istio-system.svc
  namespaceSelector:
    matchNames:
    - istio-system  # Or your Kiali namespace
  selector:
    matchLabels:
      app.kubernetes.io/name: kiali
CA File Path Note
The caFile path shown above (/etc/prometheus/configmaps/serving-certs-ca-bundle/service-ca.crt) is specific to OpenShift’s built-in cluster monitoring Prometheus. If you’re using a different Prometheus deployment, you’ll need to:
- Mount the OpenShift service CA into your Prometheus pod
- Adjust the
caFilepath accordingly
To get the service CA, create a ConfigMap with the annotation service.beta.openshift.io/inject-cabundle: "true" and OpenShift will automatically populate it with the service CA certificate.
Option 2: Static Scrape Configuration
For non-Operator Prometheus deployments, add a scrape job to your Prometheus configuration file (prometheus.yml) that targets the Kiali Service:
scrape_configs:
- job_name: 'kiali'
  scheme: https
  tls_config:
    ca_file: /path/to/service-ca.crt
    server_name: kiali.istio-system.svc
  static_configs:
  - targets:
    - kiali.istio-system.svc:9090
Option 3: Skip Certificate Verification (Not Recommended)
For testing purposes only, you can configure Prometheus to skip certificate verification. In a ServiceMonitor resource, add insecureSkipVerify to the tlsConfig:
tlsConfig:
  insecureSkipVerify: true
Or in your Prometheus configuration file (prometheus.yml), add insecure_skip_verify to the tls_config:
tls_config:
  insecure_skip_verify: true
Viewing and Analyzing Kiali Metrics
To see the metrics that are currently being emitted by Kiali, you can run the following command which simply parses the metrics endpoint data and outputs all the metrics it finds:
# For HTTP (when TLS not configured):
curl -s http://<KIALI_HOSTNAME>:9090/metrics | grep -o '^# HELP kiali_.*' | awk '{print $3}'

# For HTTPS (when TLS configured):
curl -s -k https://<KIALI_HOSTNAME>:9090/metrics | grep -o '^# HELP kiali_.*' | awk '{print $3}'
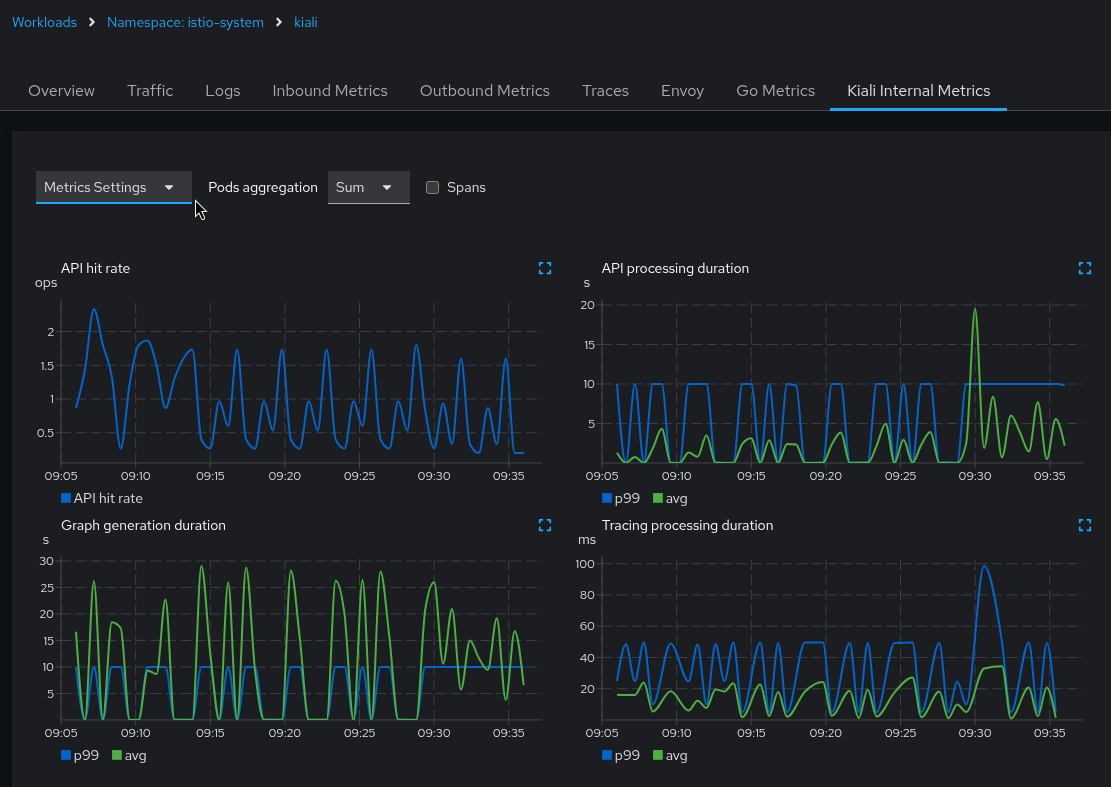
The Kiali UI itself graphs some of these metrics. In the Kiali UI, navigate to the Kiali workload and select the “Kiali Internal Metrics” tab:
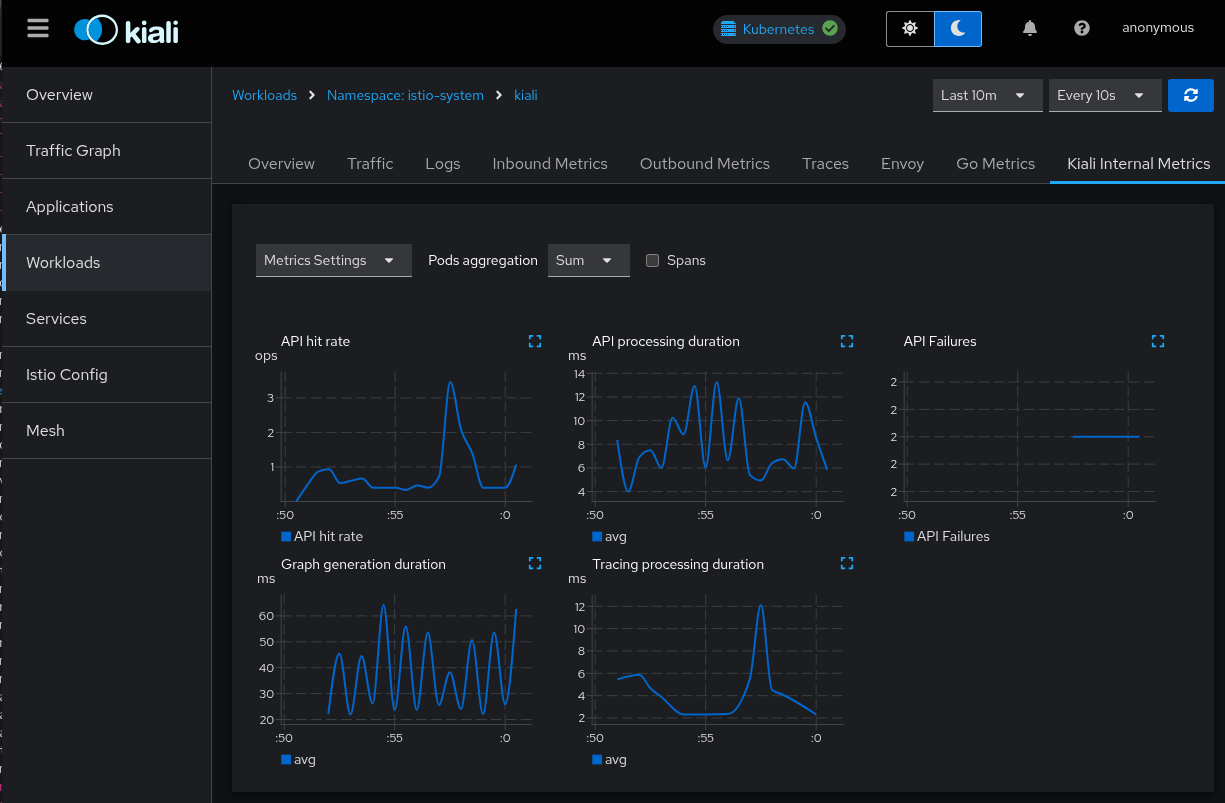
Use the Kiali UI to analyze these metrics in the same way that you would analyze your application metrics. (Note that “Tracing processing duration” will be empty if you have not integrated your Tracing backend with Kiali).
Because these are metrics collected by Promtheus, you can analyze Kiali’s metrics through Prometheus queries and the Prometheus UI. Some of the more interesting Prometheus queries are listed below.
- API routes
- Average latency per API route:
rate(kiali_api_processing_duration_seconds_sum[5m]) / rate(kiali_api_processing_duration_seconds_count[5m]) - Request rate per API route:
rate(kiali_api_processing_duration_seconds_count[5m]) - 95th percentile latency per API route:
histogram_quantile(0.95, rate(kiali_api_processing_duration_seconds_bucket[5m])) - Alert: 95th Percentile Latency > 5s:
histogram_quantile(0.95, rate(kiali_api_processing_duration_seconds_bucket[5m])) > 5s - Top 5 slowest API routes (avg latency over 5m):
topk(5, rate(kiali_api_processing_duration_seconds_sum[5m]) / rate(kiali_api_processing_duration_seconds_count[5m]))
- Average latency per API route:
- Graph
- Use the same queries as “API routes” but with the metric
kiali_graph_generation_duration_seconds_[count,sum,bucket]to get information about the graph generator. - Use the same queries as “API routes” but with the metric
kiali_graph_appender_duration_seconds_[count,sum,bucket]to get information about the graph generator appenders. This helps analyze the performance of the individual appenders that are used to build and decorate the graphs.
- Use the same queries as “API routes” but with the metric
- Tracing
- Use the same queries as “API routes” but with the metric
kiali_tracing_processing_duration_seconds_[count,sum,bucket]to get information about the groups of different Tracing queries. This helps analyze the performance of the Kiali/Tracing integration.
- Use the same queries as “API routes” but with the metric
- Metrics
- Use the same queries as “API routes” but with the metric
kiali_prometheus_processing_duration_seconds_[count,sum,bucket]to get information about the different groups of Prometheus queries. This help analyze the performance of the Kiali/Prometheus integration.
- Use the same queries as “API routes” but with the metric
- Validations
- Use the same queries as “API routes” but with the metric
kiali_validation_processing_duration_seconds_[count,sum,bucket]to get information about Istio configuration validation. This helps analyze the performance of Istio configuration validation as a whole. - Use the same queries as “API routes” but with the metric
kiali_checker_processing_duration_seconds_[count,sum,bucket]to get information about the different validation checkers. This helps analyze the performance of the individual checkers performed during the Istio configuration validation.
- Use the same queries as “API routes” but with the metric
- Failures
- Failures per API route (in the past hour):
sum by (route) (rate(kiali_api_failures_total[1h])) - Error rate percentage per API route:
100 * sum by (route) (rate(kiali_api_failures_total[1h])) / sum by (route) (rate(kiali_api_processing_duration_seconds_count[1h])) - The number of failures per API route in the past 30 minutes:
increase(kiali_api_failures_total[30m]) - The top 5 API routes with failures in the past 30 minutes
topk(5, increase(kiali_api_failures_total[30m]))
- Failures per API route (in the past hour):
Tracing
Kiali provides the ability to emit debugging traces to the distributed tracing platform, Jaeger or Grafana Tempo.
The traces can be sent in HTTP, HTTPS or gRPC protocol. It is also possible to use TLS. When tls_enabled is set to true, one of the options skip_verify or ca_name should be specified.
The traces are sent in OTel format, indicated in the collector_type setting.
server:
  observability:
    tracing:
      collector_url: "jaeger-collector.istio-system:4317"
      enabled: true
      otel:
        protocol: "grpc"
        tls_enabled: true
        skip_verify: false
        ca_name: "/tls.crt"
Usually, the tracing platforms expose different ports to collect traces in distinct formats and protocols:
- The Jaeger collector accepts OpenTelemetry Protocol over HTTP (4318) and gRPC (4317).
- The Grafana Tempo distributor accepts OpenTelemetry Protocol over HTTP (4318) and gRPC (4317). It can be configured to accept TLS.
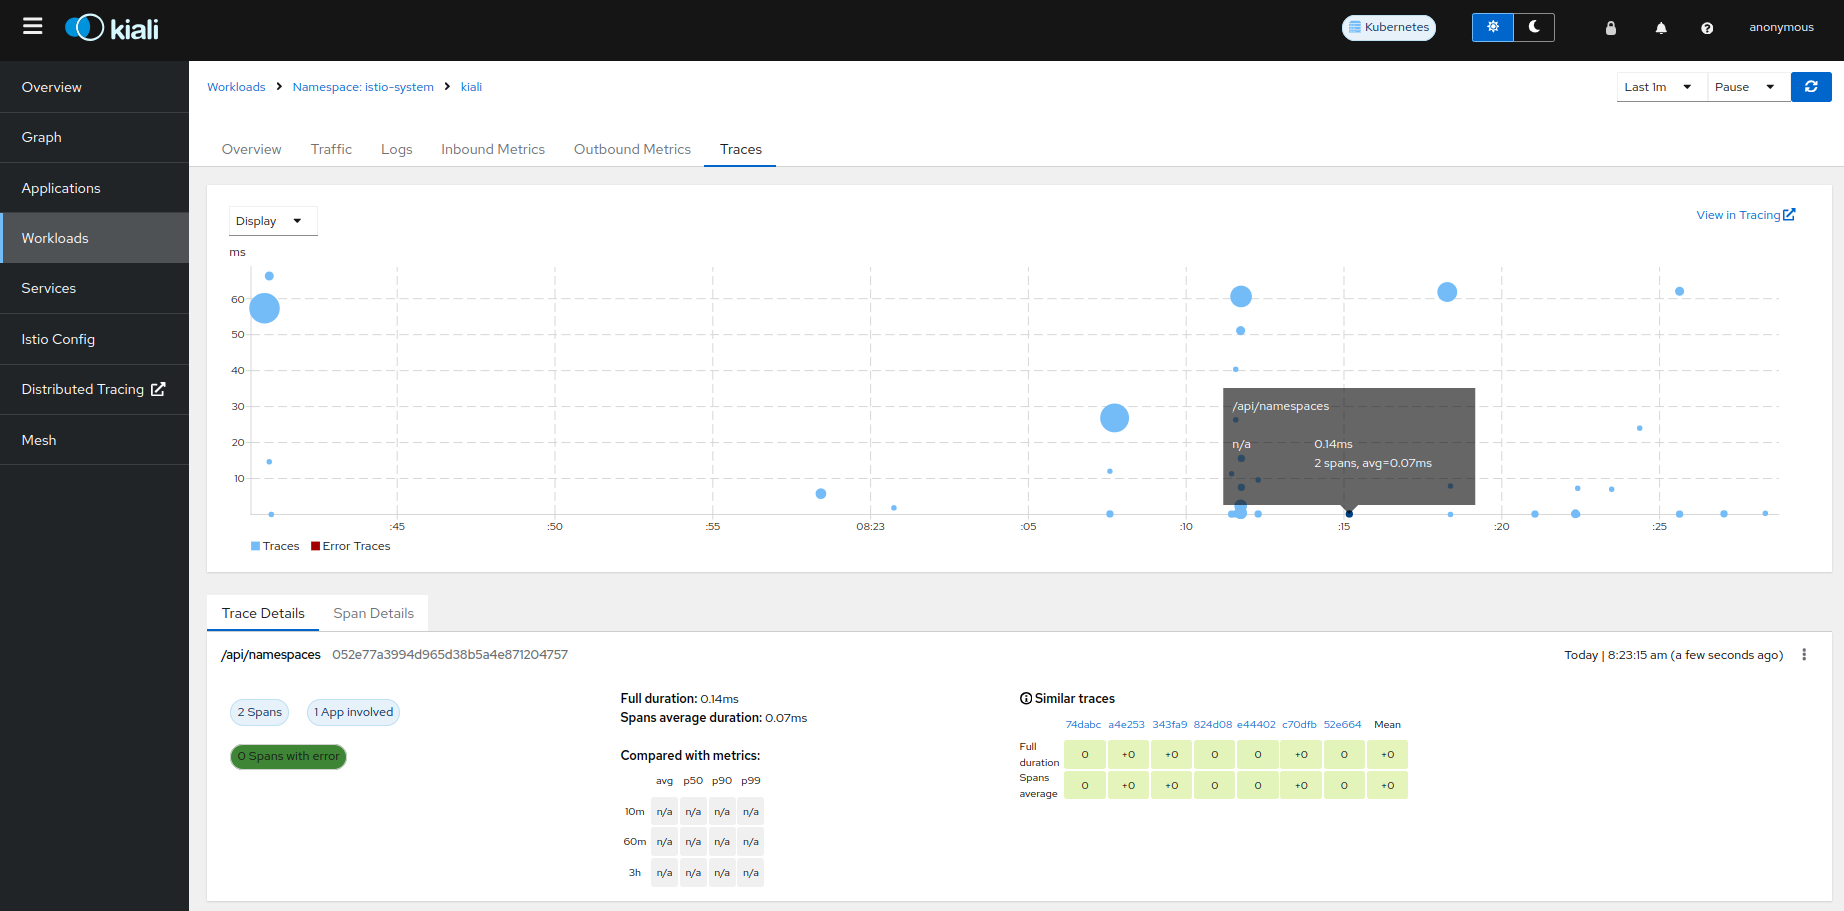
The traces emitted by Kiali can be searched in the Kiali workload:
Tracing Integration
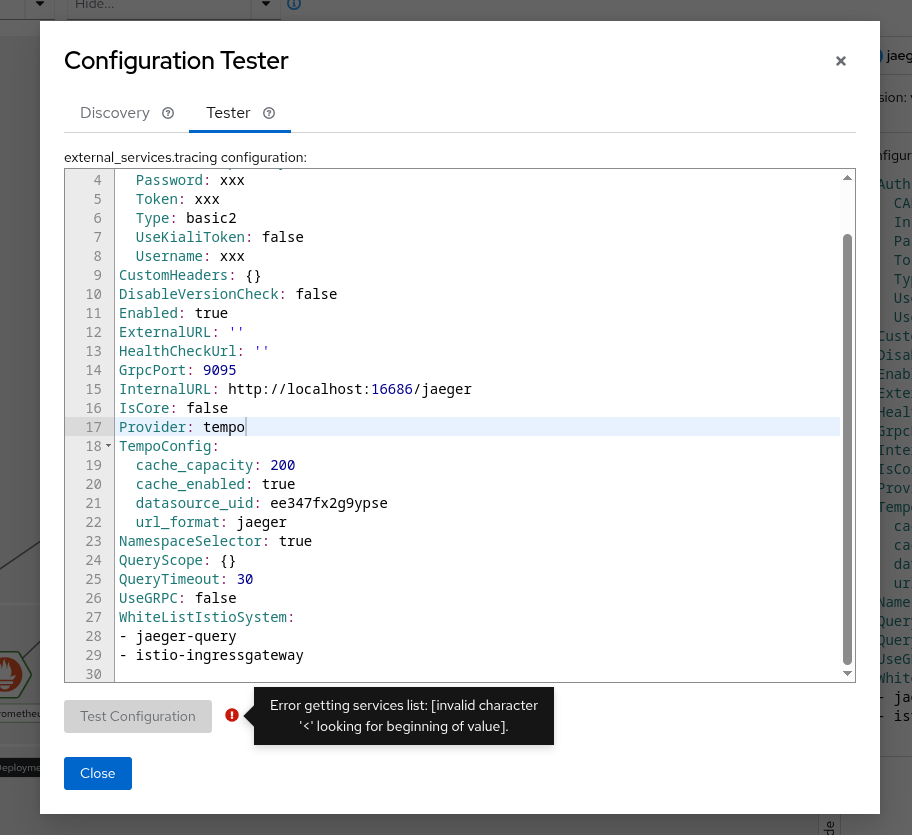
Sometimes integration with tracing can be complex, but since version 2.11, a tool is available to help with the configuration. It’s available on the mesh page, by clicking on the tracing node. From there, under “Configuration Tester,” it will show 2 different features:
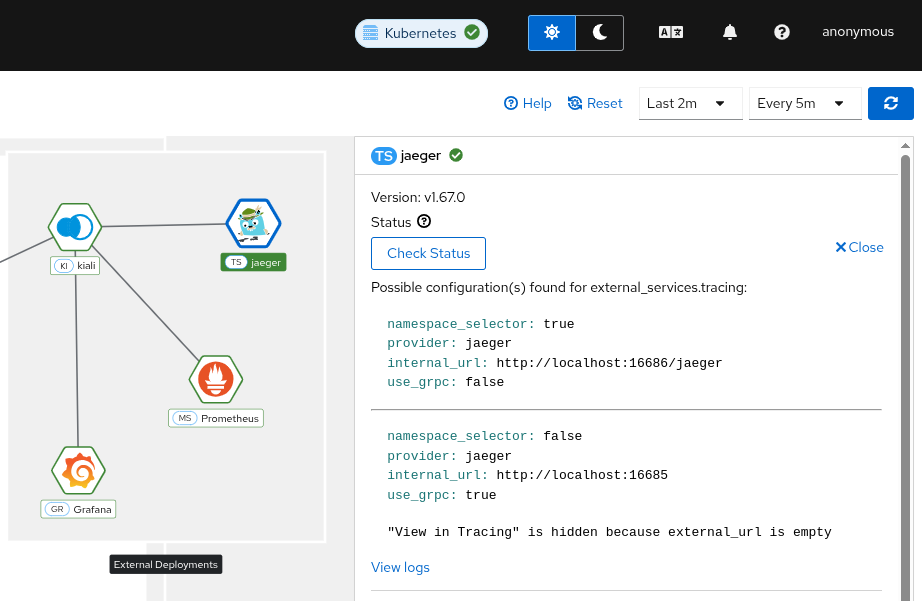
- Discovery tool
- Configuration tester
The discovery feature will show possible valid configurations that might work based on the tracing open ports.
It’s important that at least the URL is properly defined - external_services.tracing.internal_url if it’s inside the cluster, or external_services.tracing.external_url if it’s outside.
The logs section will provide more insights about the tests done, the open ports, the errors found, that can help to troubleshoot in case of more complex scenarios, like urls with tenants or https.
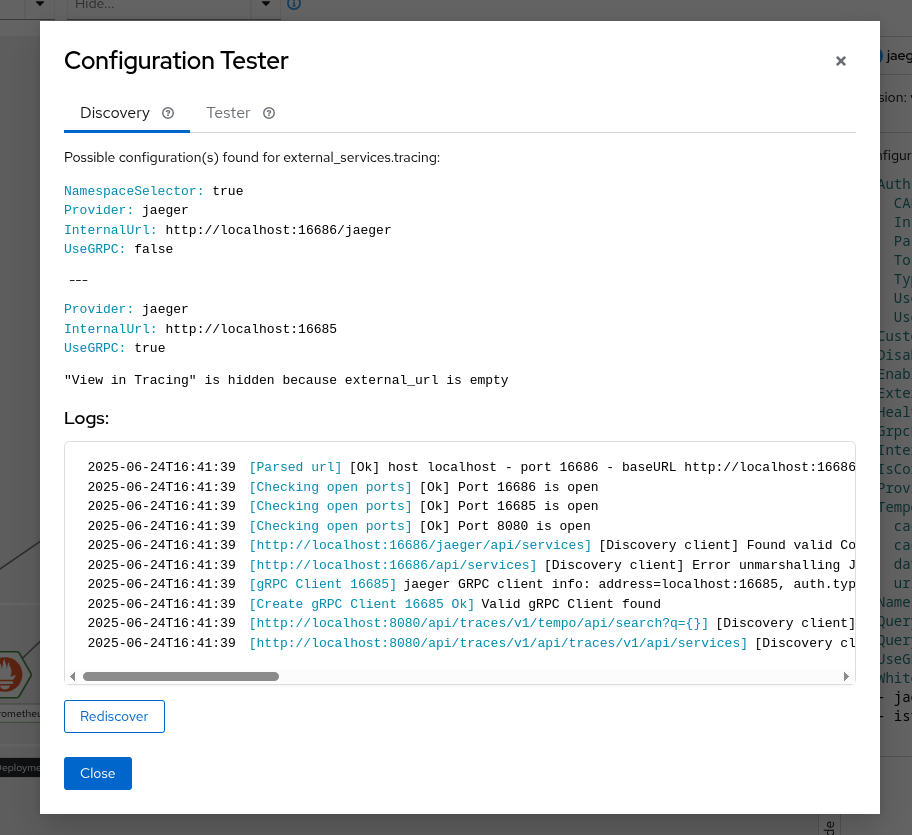
The configuration tester allows to test a specific configuration without having to edit the config map and wait for the Kiali pod to be restarted. Please note that the configuration will not be saved permanently.
Profiler
The Kial Server is integrated with the Go pprof profiler. By default, the integration is disabled. If you want the Kiali Server to generate profile reports, enable it in the Kiali CR:
spec:
  server:
    profiler:
      enabled: true
Once the profiler is enabled, you can access the profile reports by pointing your browser to the <kiali-root-url>/debug/pprof endpoint and click the link to the profile report you want. You can obtain a specific profile report by appending the name of the profile to the URL. For example, if your Kiali Server is found at the root URL of “http://localhost:20001/kiali”, and you want the heap profile report, the URL http://localhost:20001/kiali/debug/pprof/heap will provide the data for that report.
Go provides a pprof tool that you can then use to visualize the profile report. This allows you to analyze the data to help find potential problems in the Kiali Server itself. For example, you can start the pprof UI on port 8080 which allows you to see the profile data in your browser:
go tool pprof -http :8080 http://localhost:20001/kiali/debug/pprof/heap
You can download a profile report and store it as a file for later analysis. For example:
curl -o pprof.txt http://localhost:20001/kiali/debug/pprof/heap
You can then examine the data found in the profile report:
go tool pprof -http :8080 ./pprof.txt
Your browser will be opened to http://localhost:8080/ui which allows you to see the profile report.
Kiali CR Status
When you install the Kiali Server via the Kiali Operator, you do so by creating a Kiali CR. One quick way to debug the status of a Kiali Server installation is to look at the Kiali CR’s status field (e.g. kubectl get kiali --all-namespaces -o jsonpath='{..status}'). The operator will report any installation errors within this Kiali CR status. If the Kiali Server fails to install, always check the Kiali CR status field first because in many instances you will find an error message there that can provide clear guidance on what to do next.
Debugging the Kiali Operator
The Kiali Operator is built on the Ansible Operator SDK. It has multiple independent logging controls that each affect a different subsystem. They are listed here in order of how commonly they are needed for debugging.
Ansible Playbook Verbosity
This controls how verbose the Ansible playbook output is during reconciliation (equivalent to the -v, -vv, -vvv flags passed to ansible-runner). This is useful for debugging issues within the Ansible playbook logic itself, such as seeing the values of variables or the details of each task.
Set the ansible.sdk.operatorframework.io/verbosity annotation on the Kiali or OSSMConsole CR. The value is an integer from 0 (default, no extra verbosity) to 5 (most verbose):
metadata:
  annotations:
    ansible.sdk.operatorframework.io/verbosity: "1"
See the Ansible Operator SDK advanced options documentation for more details on this.
Ansible Debug Logs
When set to true, this causes the operator to print the full ansible-runner stdout after each reconciliation completes. This is useful for seeing the complete Ansible output including all task results.
When Installed via Helm
Set the debug.enabled value:
helm upgrade kiali-operator kiali/kiali-operator --set debug.enabled=true
When Installed via OLM
Add the environment variable to the Subscription’s spec.config.env:
spec:
  config:
    env:
    - name: ANSIBLE_DEBUG_LOGS
      value: "true"
Go Structured Log Level
--zap-log-level controls the log level of the Go-based controller-runtime framework that manages the operator’s reconciliation loop. This is the setting needed for diagnosing why reconciliation is being triggered, which is typically only necessary when investigating unexpected or periodic reconciliations.
The supported levels are:
info: Logs startup information, controller events, and proxy cache reads.debug: Additionally logs the event handler messages that tell you exactly what event triggered each reconciliation.
When set to debug, the operator will emit a log message like the following immediately before each reconciliation:
{"level":"debug","ts":"2026-02-10T20:06:23Z","logger":"ansible.handler","msg":"Metrics handler event","Event type":"Update","GroupVersionKind":"kiali.io/v1alpha1, Kind=Kiali","Name":"kiali","Namespace":"kiali-operator"}
The key fields in this message are:
Event type: One ofCreate,Update,Delete, orGeneric- tells you what kind of change triggered the reconciliation.GroupVersionKind: Which resource type changed (e.g.kiali.io/v1alpha1, Kind=Kialiorkiali.io/v1alpha1, Kind=OSSMConsole).Name/Namespace: Which specific CR instance was affected.
To find these messages in the logs:
kubectl logs deployment/kiali-operator -n <operator-namespace> | grep 'ansible.handler'
The Go log level is controlled by the --zap-log-level container argument on the operator deployment. The method for changing this depends on how the operator was installed.
When Installed via Helm
When the operator is installed via Helm, you can patch the Deployment directly since there is no OLM to revert the change:
kubectl patch deployment kiali-operator -n <operator-namespace> --type='json' \
  -p='[{"op":"replace","path":"/spec/template/spec/containers/0/args/0","value":"--zap-log-level=debug"}]'
To revert back to normal logging, just run that command again with the --zap-log-level set back to info.
When Installed via OLM
When the operator is installed via OLM (Operator Lifecycle Manager), you cannot patch the Deployment directly because OLM will revert the change. The OLM Subscription config also does not support overriding container args. Instead, you must patch the ClusterServiceVersion (CSV), which OLM treats as the authoritative source for the deployment spec.
To enable debug logging:
kubectl patch csv $(kubectl get csv -n <operator-namespace> --no-headers -o custom-columns=NAME:.metadata.name | grep '^kiali-operator') \
  -n <operator-namespace> --type='json' \
  -p='[{"op":"replace","path":"/spec/install/spec/deployments/0/spec/template/spec/containers/0/args/0","value":"--zap-log-level=debug"}]'
OLM will automatically roll out a new operator pod with the updated args.
To revert back to normal logging, just run that command again with the --zap-log-level set back to info.
openshift-operators. On vanilla Kubernetes with OLM, it is typically operators.
Ansible Task Profiler
The operator includes an Ansible task profiler that uses the profile_tasks Ansible callback plugin. When enabled, it logs the execution time of each Ansible task to the operator pod’s log output at the end of each reconciliation run. This is useful for identifying slow tasks in the operator’s Ansible playbooks.
When Installed via Helm
Set the debug.enableProfiler value:
helm upgrade kiali-operator kiali/kiali-operator --set debug.enableProfiler=true
When Installed via OLM
Set the ANSIBLE_CONFIG environment variable to the profiler configuration in the Subscription’s spec.config.env:
spec:
  config:
    env:
    - name: ANSIBLE_CONFIG
      value: "/opt/ansible/ansible-profiler.cfg"
To disable the profiler, set the value back to /etc/ansible/ansible.cfg.
Examples
The following are just some examples of how you can use the Kiali signals to help diagnose problems within Kiali itself.
Use log messages to find out what is slow
spec.deployment.logger.log_format = json). Use grep, sed, and related tools to query logs if Kiali is logging the output as text.
Make sure you turn on trace logging (spec.deployment.logger.log_level = trace) in order to get the log messages needed for this kind of analysis.
Find all the logs that show APIs with long execution times. Because Kiali is not logging times faster than 3 seconds, this query will return all the routes (i.e. the API endpoints) that were 3 seconds or slower:
kubectl logs -n istio-system deployments/kiali | \
  jq -rR 'fromjson? | select(.timer) | .route' | \
  sort -u
Suppose that returned only one route name - GraphNamespaces. This means the main graph page was slow. Let’s examine the logs for a request for that API. We first find the ID of the last request that was made for the GraphNamespaces API:
kubectl logs -n istio-system deployments/kiali | \
  jq -rR 'fromjson? | select(.route == "GraphNamespaces") | .["request-id"]' | tail -n 1
Take the ID string that was output (in this example, it is d0staq6nq35s73b6mdug) and use it to examine the logs for that request only:
kubectl logs -n istio-system deployments/kiali | \
  jq -rR 'fromjson? | select(."request-id" == "d0staq6nq35s73b6mdug")'
To make the output less verbose, we can eliminate some of the message’s attributes that we do not need to see:
kubectl logs -n istio-system deployments/kiali | \
  jq -rR 'fromjson? | select(."request-id" == "d0staq6nq35s73b6mdug") | \
  del(.["level", "route", "route-pattern", "group", "request-id"])'
The output of that command is the log messages, in chronological order, as the request to generate the graph was processed in the Kiali server. Examining timestamps, timer durations, warnings, and other data in these messages can help determine what made the request slow:
{
  "ts": "2025-05-30T15:57:28Z",
  "msg": "Build [versionedApp] graph for [1] namespaces [map[bookinfo:{bookinfo 1m0s false false}]]"
}
{
  "ts": "2025-05-30T15:57:28Z",
  "msg": "Build traffic map for namespace [{bookinfo 1m0s false false}]"
}
{
  "appender": "workloadEntry",
  "ts": "2025-05-30T15:57:28Z",
  "msg": "Running workload entry appender"
}
{
  "appender": "workloadEntry",
  "ts": "2025-05-30T15:57:28Z",
  "msg": "WorkloadEntries found: 0"
}
{
  "appender": "workloadEntry",
  "ts": "2025-05-30T15:57:28Z",
  "msg": "WorkloadEntries found: 0"
}
{
  "appender": "workloadEntry",
  "ts": "2025-05-30T15:57:28Z",
  "msg": "WorkloadEntries found: 0"
}
{
  "appender": "workloadEntry",
  "ts": "2025-05-30T15:57:28Z",
  "msg": "WorkloadEntries found: 0"
}
{
  "appender": "workloadEntry",
  "ts": "2025-05-30T15:57:28Z",
  "msg": "WorkloadEntries found: 0"
}
{
  "appender": "workloadEntry",
  "ts": "2025-05-30T15:57:28Z",
  "msg": "WorkloadEntries found: 0"
}
{
  "appender": "workloadEntry",
  "ts": "2025-05-30T15:57:28Z",
  "msg": "WorkloadEntries found: 0"
}
{
  "appender": "idleNode",
  "namespace": "bookinfo",
  "timer": "GraphAppenderTime",
  "duration": "3.153312011s",
  "ts": "2025-05-30T15:57:31Z",
  "msg": "Namespace graph appender time"
}
{
  "ts": "2025-05-30T15:57:31Z",
  "msg": "Generating config for [common] graph..."
}
{
  "ts": "2025-05-30T15:57:31Z",
  "msg": "Done generating config for [common] graph"
}
{
  "inject-service-nodes": "true",
  "graph-kind": "namespace",
  "graph-type": "versionedApp",
  "timer": "GraphGenerationTime",
  "duration": "3.280609145s",
  "ts": "2025-05-30T15:57:31Z",
  "msg": "Namespace graph generation time"
}
{
  "status-code": "200",
  "timer": "APIProcessingTime",
  "duration": "3.280986943s",
  "ts": "2025-05-30T15:57:31Z",
  "msg": "API processing time"
}
Examining those log messages of a single request to generate the graph easily shows that the idleNode graph appender code is very slow (taking over 3 seconds to complete). Thus, the first thing that should be suspected as the cause of the slow graph generation is the code that generates idle nodes in the graph.
Use Prometheus to find out what is slow
You can use Prometheus to look at Kiali’s metrics to help analyze problems. Even though Kiali does not log metric timers that are faster than 3 seconds, those metrics are still stored in Prometheus.
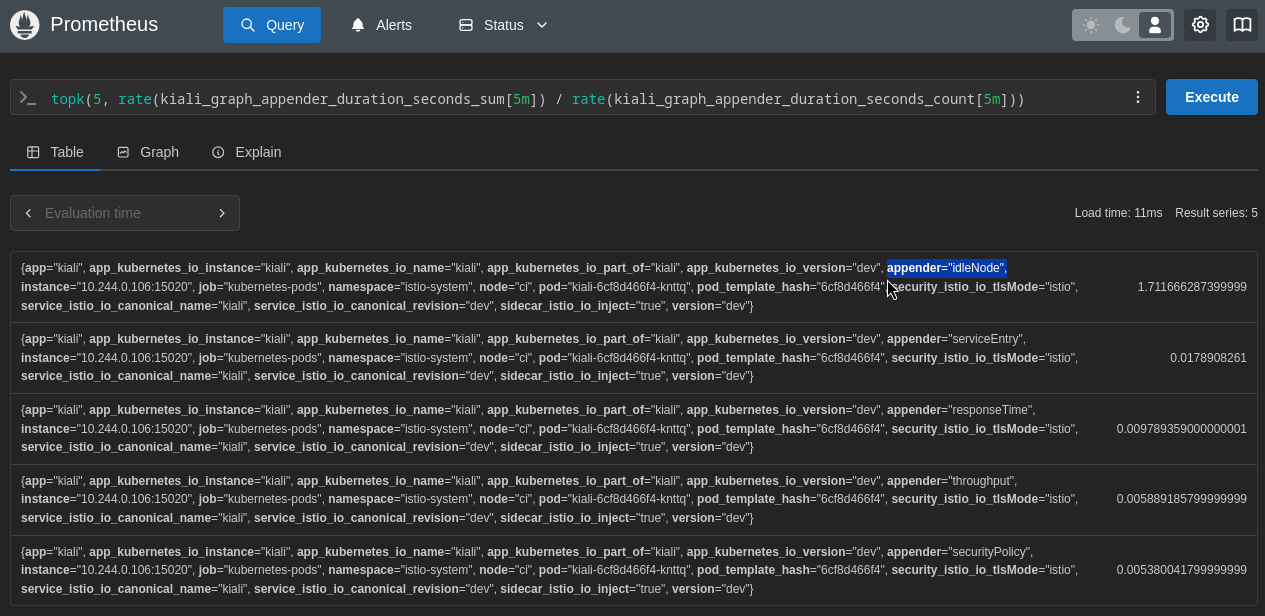
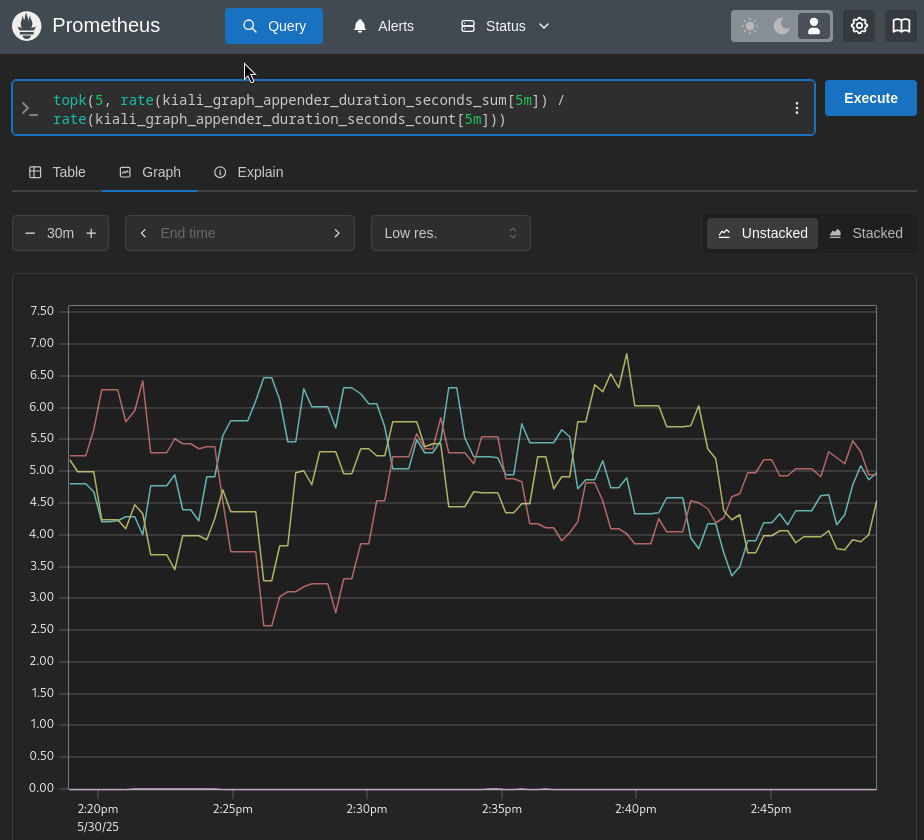
We can look at the metrics that are emitted by the graph appenders to see how they are performing. This shows the top-5 slowest graph appenders for this specific Kiali environment - and here we see the idleNode appender is by far the worst offender. Again, this helps pin-point a cause of slow graph generation - in this case, the idleNode graph appender code:
Prometheus query: topk(5, rate(kiali_graph_appender_duration_seconds_sum[5m]) / rate(kiali_graph_appender_duration_seconds_count[5m]))
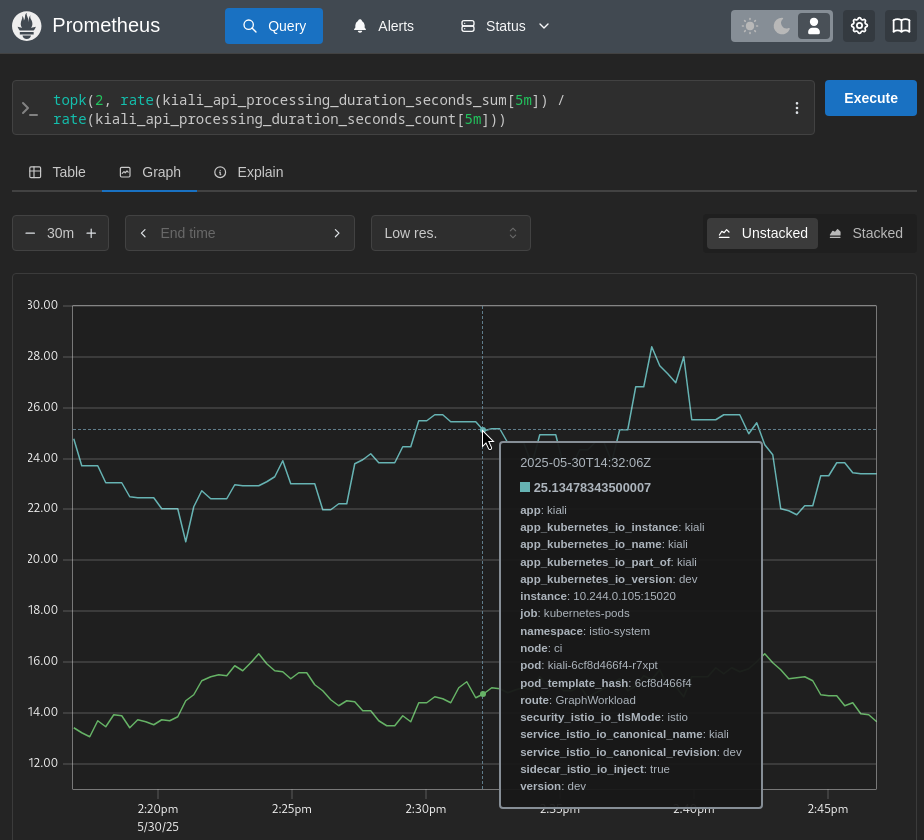
If you are not sure what exactly is slowing down the Kiali Server, one of the first things to examine is the duration of time each API takes to complete. Here are the top-2 slowest Kiali APIs for this specific Kiali environment:
Prometheus query: topk(2, rate(kiali_api_processing_duration_seconds_sum[5m]) / rate(kiali_api_processing_duration_seconds_count[5m]))
The above shows that the graph generation is slow. So let’s next look at the graph appenders to see if any one of them could be the culprit of the poor performance:
Prometheus query: topk(5, rate(kiali_graph_appender_duration_seconds_sum[5m]) / rate(kiali_graph_appender_duration_seconds_count[5m]))
In this specific case, it does not look like any one of the appenders is the source of the problem. They all appear to be having issues with poor performance. Since the graph generation relies heavily on querying the Prometheus server, another thing to check is the time it takes for Kiali to query Prometheus:
Prometheus query: topk(5, rate(kiali_prometheus_processing_duration_seconds_sum[5m]) / rate(kiali_prometheus_processing_duration_seconds_count[5m]))
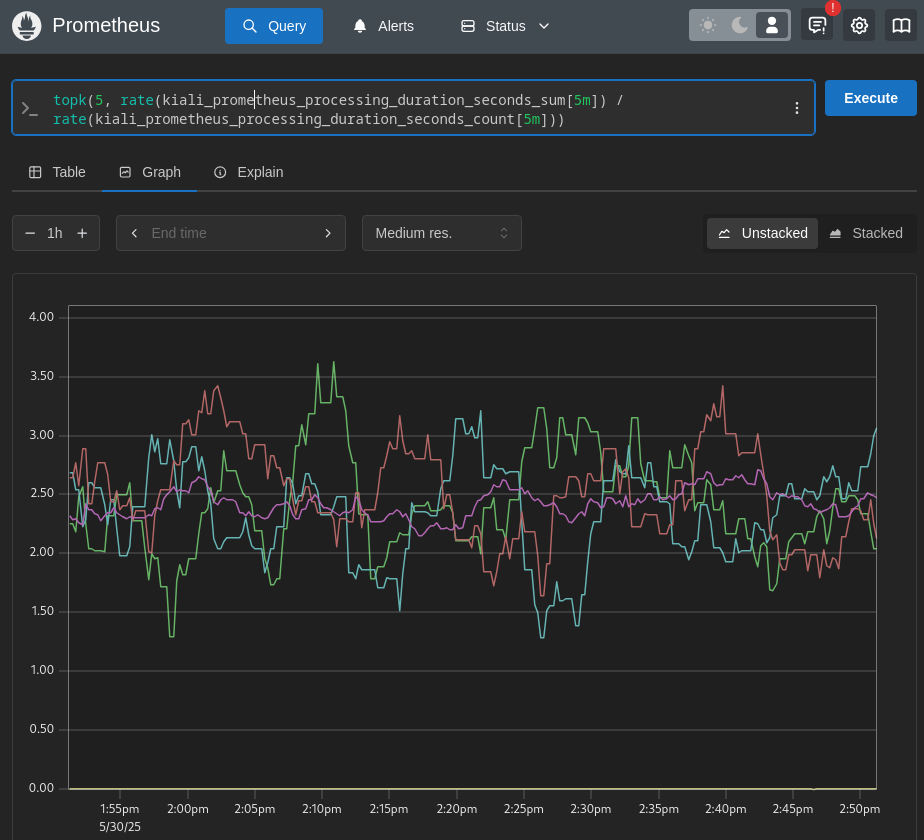
Here it looks like Prometheus itself might be the source of the poor performance. All of the Prometheus queries Kiali is requesting are taking over a full second to complete (some are taking as much as 3.5 seconds). At this point, you should check the Prometheus server and the network connection between Kiali and Prometheus as possible causes of the slow Kiali performance. Perhaps Kiali is asking for so much data from Prometheus, Prometheus cannot keep up. Perhaps there is a network outage causing the Kiali requests to Prometheus being slow. But at least in this case we’ve pin-pointed a bottleneck and can narrow our focus when searching for the root cause of the problem.
Use Kiali to find out what is slow
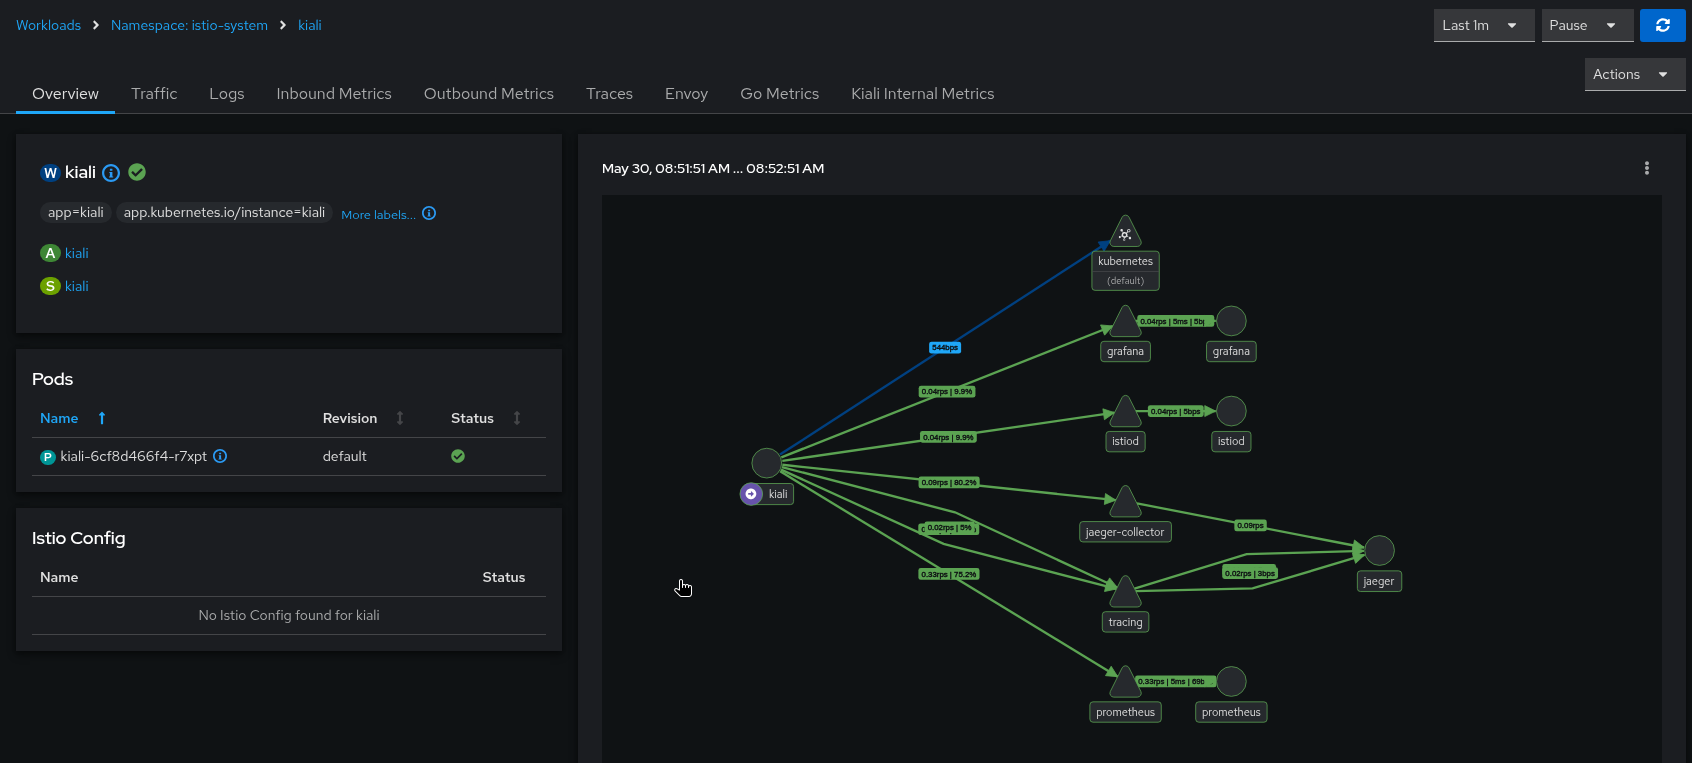
Kiali itself can be used to help find its own internal problems.
Navigate to the Kiali workload, and select the Kiali Internal Metrics tab. In this case, we can see some APIs are very slow due to the high p99 and average values. We can eliminate the tracing integration as the source of the problem because all processing of tracing requests are taking an average of about 20ms to complete. However, the graph generation appears to be very slow, taking an average of between 15 and 30 seconds to complete each request:
The Kiali UI allows you to expand each mini-chart into a full size chart for easier viewing. You can also display the different metric labels as separate chart lines. In this case, the graph is showing the duration times for the GraphNamespaces and GraphWorkload APIs:
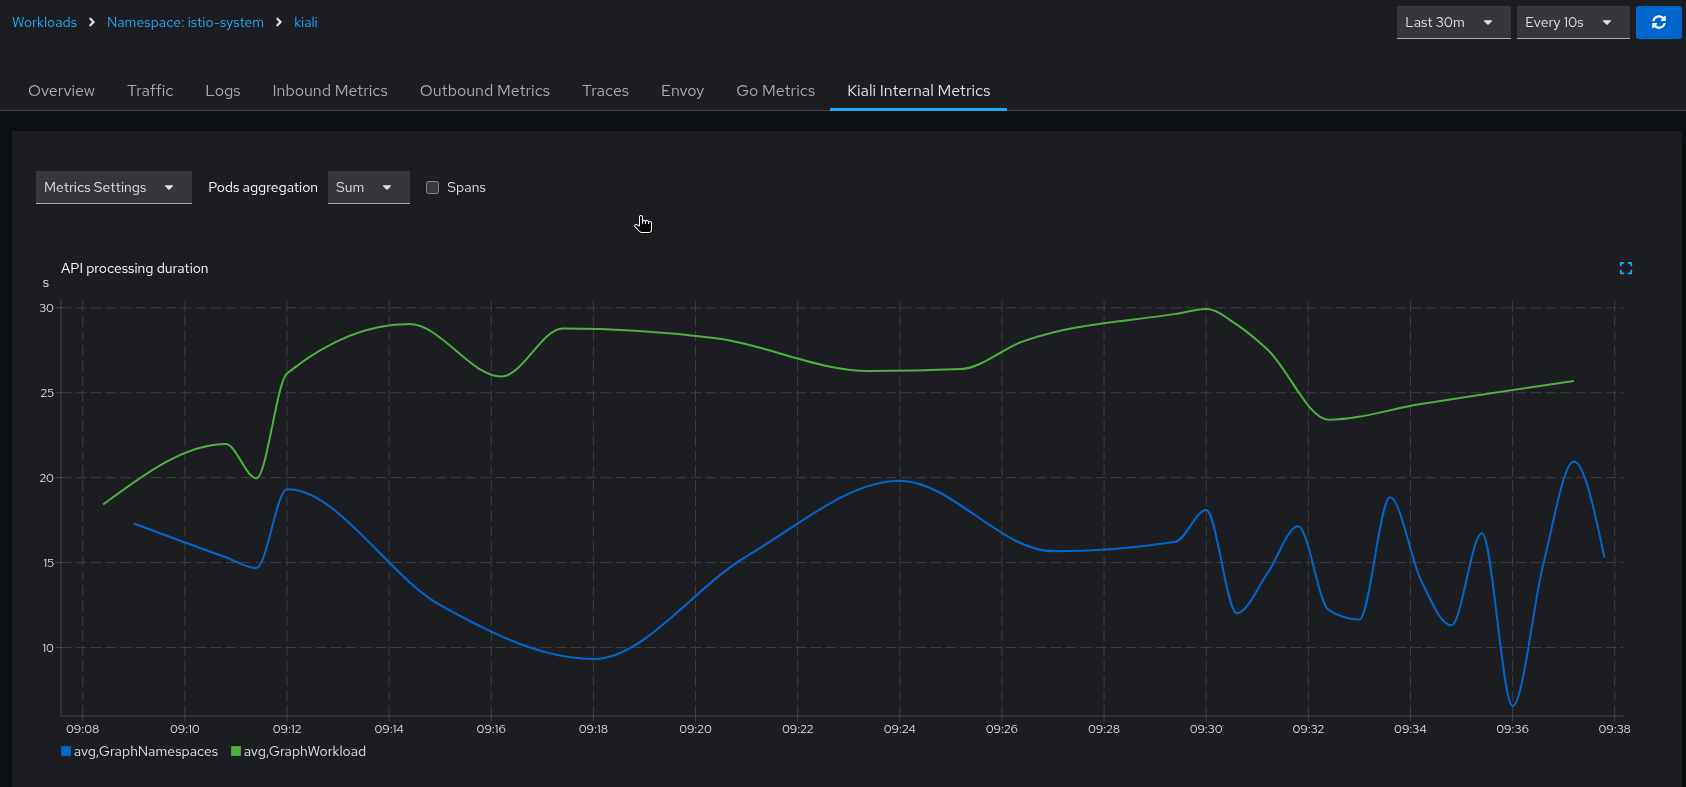
The above metric charts clearly show a performance problem in the graph generation. Because the graph generation code requests many Prometheus queries, one of the next things to check is the performance of the Kiali-Prometheus integration. One fast and easy way to see how the Prometheus queries are performing is to look at the Kiali workload’s Overview tab, specifically, the graph shown on the right side. Look at the edge between the Kiali node and the Prometheus node for indications of problems (the edge label will show you throughput numbers; the color of the edge will indicate request errors):