1 - ACM Observability
Configure Kiali to use Red Hat Advanced Cluster Management Observability for centralized metrics in multi-cluster OpenShift environments.
OpenShift Only: This guide is specifically for Red Hat OpenShift environments using Red Hat Advanced Cluster Management (ACM) for Kubernetes. ACM is an OpenShift-specific product.
Overview
Red Hat Advanced Cluster Management (ACM) provides centralized observability for multi-cluster OpenShift environments through its Observability Service. When ACM Observability is enabled, metrics from all managed clusters (including the hub cluster itself) are collected and aggregated into a central Thanos-based storage system.
Kiali can query these aggregated metrics either through ACM’s external Observatorium API (using mTLS authentication) or directly through internal Thanos services. This guide explains both options, with detailed steps for the Observatorium API approach.
Architecture
Components
On the Hub Cluster:
- ACM Observability Service: Centralized observability platform
- Observatorium API: External HTTPS endpoint with mTLS authentication
- Thanos: Metrics storage and query engine (Query, Query Frontend, Receive, Store)
On Managed Clusters (Hub + Spokes):
- User Workload Monitoring (UWM): OpenShift’s Prometheus for user workloads
- PodMonitor/ServiceMonitor: Scrape Istio metrics from:
- Sidecar proxies (in application namespaces)
- Control plane (istiod in istio-system)
- Ztunnel (in ztunnel namespace, for L4 metrics in Ambient mode)
- Waypoint proxies (in application namespaces, for L7 metrics in Ambient mode)
- Metrics Allowlist ConfigMaps: Define which metrics ACM should collect
- Metrics Collector: Runs on each managed cluster and pushes its Prometheus metrics to the hub cluster’s Thanos every 5 minutes (default)
Kiali Deployment Location:
Kiali can be deployed on any cluster with network access to:
- The hub cluster’s metrics backend (Observatorium API or internal Thanos services)
- Each managed cluster’s Kubernetes API (for workload and configuration data)
Common deployment locations:
- Hub cluster (recommended): Co-located with ACM for lower latency metric queries and simplified networking. Can use internal Thanos services (HTTP) or external Observatorium API (HTTPS). Typically requires external deployment mode (
ignore_home_cluster: true) since the hub usually doesn’t run mesh workloads or an Istio control plane.
- Spoke/managed cluster: Kiali deployed alongside the mesh workloads or the Istio control plane. Must use external Observatorium API route.
- Separate management cluster: Kiali deployed externally in dedicated “external deployment” mode (see External Kiali). Must use external Observatorium API route.
This guide assumes Kiali is deployed on the hub cluster in external deployment mode, but the configuration applies to any deployment location.
Metrics Flow
There are two independent flows:
Ingestion (managed cluster → hub):
- Istio data plane components (sidecars, ztunnel, or waypoint proxies) expose metrics at
:15020/stats/prometheus.
- User Workload Monitoring Prometheus scrapes those metrics (typically every 30s).
- The ACM observability collector/agent on the managed cluster reads from Prometheus and ships metrics to the hub (typically every 5 minutes).
- The hub stores them in Thanos Receive/Store and serves them through Thanos Query Frontend.
Query (Kiali → hub):
Kiali can query metrics through either of these paths:
Via Observatorium API Route (HTTPS with mTLS):
- Kiali queries the external Observatorium API route.
- Observatorium forwards the request to Thanos Query Frontend.
- Thanos Query Frontend reads from Thanos Store/Receive and returns the result back through Observatorium to Kiali.
Via Internal Thanos Service (HTTP):
- Kiali queries the internal Thanos Query Frontend service directly within the cluster, bypassing Observatorium.
Expected Latency: 5-6 minutes from traffic generation to visibility in Kiali due to the 5-minute (default) push interval.
Prerequisites
1. ACM Observability Service
ACM MultiClusterObservability must be installed on the hub cluster:
# Verify ACM Observability is running
oc get mco observability

# Check Observatorium API route
oc get route observatorium-api -n open-cluster-management-observability
2. User Workload Monitoring
User Workload Monitoring must be enabled on all clusters (hub and spokes):
# Enable UWM by editing cluster-monitoring-config
oc -n openshift-monitoring edit configmap cluster-monitoring-config

# Add:
# data:
#   config.yaml: |
#     enableUserWorkload: true

# Verify UWM pods are running
oc get pods -n openshift-user-workload-monitoring
See: Enabling monitoring for user-defined projects
3. Istio Metrics Collection
Create ServiceMonitor and PodMonitor resources to collect Istio metrics. The PodMonitor for sidecars must be created in each namespace with Istio sidecars because OpenShift monitoring ignores namespaceSelector in these resources. The ServiceMonitor for istiod is created once in istio-system.
ServiceMonitor for istiod (in istio-system):
apiVersion: monitoring.coreos.com/v1
kind: ServiceMonitor
metadata:
  name: istiod-monitor
  namespace: istio-system
spec:
  targetLabels:
  - app
  selector:
    matchLabels:
      istio: pilot
  endpoints:
  - port: http-monitoring
    interval: 30s
PodMonitor for Istio proxies (must be applied in every mesh namespace):
apiVersion: monitoring.coreos.com/v1
kind: PodMonitor
metadata:
  name: istio-proxies-monitor
  namespace: <your-mesh-namespace>
spec:
  selector:
    matchExpressions:
    - key: istio-prometheus-ignore
      operator: DoesNotExist
  podMetricsEndpoints:
  - path: /stats/prometheus
    interval: 30s
    relabelings:
    - action: keep
      sourceLabels: ["__meta_kubernetes_pod_container_name"]
      regex: "istio-proxy"
    - action: keep
      sourceLabels: ["__meta_kubernetes_pod_annotationpresent_prometheus_io_scrape"]
    - action: replace
      regex: (\d+);(([A-Fa-f0-9]{1,4}::?){1,7}[A-Fa-f0-9]{1,4})
      replacement: '[$2]:$1'
      sourceLabels: ["__meta_kubernetes_pod_annotation_prometheus_io_port","__meta_kubernetes_pod_ip"]
      targetLabel: "__address__"
    - action: replace
      regex: (\d+);((([0-9]+?)(\.|$)){4})
      replacement: '$2:$1'
      sourceLabels: ["__meta_kubernetes_pod_annotation_prometheus_io_port","__meta_kubernetes_pod_ip"]
      targetLabel: "__address__"
    - sourceLabels: ["__meta_kubernetes_pod_label_app_kubernetes_io_name","__meta_kubernetes_pod_label_app"]
      separator: ";"
      targetLabel: "app"
      action: replace
      regex: "(.+);.*|.*;(.+)"
      replacement: "${1}${2}"
    - sourceLabels: ["__meta_kubernetes_pod_label_app_kubernetes_io_version","__meta_kubernetes_pod_label_version"]
      separator: ";"
      targetLabel: "version"
      action: replace
      regex: "(.+);.*|.*;(.+)"
      replacement: "${1}${2}"
    - sourceLabels: ["__meta_kubernetes_namespace"]
      action: replace
      targetLabel: namespace
    - action: replace
      replacement: "<your-mesh-identification-string>"
      targetLabel: mesh_id
See: Configuring OpenShift Monitoring with Service Mesh
Ambient Mode Metrics
If you are using Istio’s Ambient mode instead of (or in addition to) sidecar mode, you need additional PodMonitors to collect metrics from the Ambient data plane components.
Understanding Ambient Mode Metrics
Ambient mode uses a layered architecture with two metric sources:
Ztunnel (L4 metrics only)
- Runs as a DaemonSet (namespace varies by installation)
- Handles all L4 traffic for pods enrolled in ambient mode
- Produces TCP-level metrics:
istio_tcp_sent_bytes_totalistio_tcp_received_bytes_totalistio_tcp_connections_opened_totalistio_tcp_connections_closed_total
- Does not produce HTTP metrics
Waypoint proxies (L7 metrics)
- Run as Deployments in application namespaces
- Optional L7 proxies deployed per-namespace or per-service
- Produce full HTTP metrics (same as sidecars):
istio_requests_totalistio_request_duration_milliseconds_*istio_request_bytes_*istio_response_bytes_*- Plus all TCP metrics listed above
If you only use ztunnel (no waypoints), Kiali will show TCP traffic but not HTTP-level details like response codes or latency histograms.
PodMonitor for Ztunnel
Create a PodMonitor in the namespace where ztunnel runs. Ztunnel pods expose metrics using the same interface as sidecars:
- Container name:
istio-proxy
- Annotation:
prometheus.io/scrape: "true"
- Metrics path:
/stats/prometheus on port 15020
Because ztunnel uses the same metrics interface, you can use the same PodMonitor configuration shown in the Istio Metrics Collection section above, changing only the namespace field to match your ztunnel namespace.
Note: The ztunnel namespace location depends on your Istio installation method. Verify your ztunnel namespace with: oc get pods -l app=ztunnel -A
PodMonitor for Waypoint Proxies
Create a PodMonitor in each namespace with a waypoint. Waypoint pods also expose metrics using the same interface as sidecars:
- Container name:
istio-proxy
- Annotation:
prometheus.io/scrape: "true"
- Metrics path:
/stats/prometheus on port 15020
Because waypoints use the same metrics interface, you can use the same PodMonitor configuration shown in the Istio Metrics Collection section above.
4. Metrics Allowlist Configuration
ACM only collects metrics that are explicitly allowlisted. For Istio metrics to be collected, create a ConfigMap named observability-metrics-custom-allowlist in the source namespace (see note below) with key uwl_metrics_list.yaml:
apiVersion: v1
kind: ConfigMap
metadata:
  name: observability-metrics-custom-allowlist
  namespace: <your-mesh-namespace>
data:
  uwl_metrics_list.yaml: |
    names:
    # Core Istio metrics below. For additional metrics that Kiali uses,
    # see: https://kiali.io/docs/faq/general/#requiredmetrics
    #
    # L7 (HTTP) metrics - from sidecars and waypoint proxies
    - istio_requests_total
    - istio_request_duration_milliseconds_bucket
    - istio_request_duration_milliseconds_sum
    - istio_request_duration_milliseconds_count
    - istio_request_bytes_bucket
    - istio_request_bytes_sum
    - istio_request_bytes_count
    - istio_response_bytes_bucket
    - istio_response_bytes_sum
    - istio_response_bytes_count
    # L4 (TCP) metrics - from sidecars, waypoint proxies, AND ztunnel
    - istio_tcp_sent_bytes_total
    - istio_tcp_received_bytes_total
    - istio_tcp_connections_opened_total
    - istio_tcp_connections_closed_total
Critical: The ConfigMap must be in the source namespace where metrics originate (e.g., istio-system, application namespaces), NOT in open-cluster-management-observability.
Ambient Mode: The same allowlist works for all Istio data plane components. However, ztunnel only produces TCP metrics (istio_tcp_*), so HTTP metrics in the allowlist will have no data from ztunnel. Waypoints produce both TCP and HTTP metrics, same as sidecars. Create the allowlist ConfigMap in each namespace where you have a PodMonitor, including the namespace where ztunnel runs and any namespaces with waypoint proxies.
See: Adding user workload metrics
Configuring Kiali for ACM Observability
Choosing Between Observatorium API and Internal Thanos Services
You have two options for connecting Kiali to ACM metrics:
Option 1: Observatorium API Route (HTTPS with mTLS)
external_services:
  prometheus:
    url: "https://observatorium-api-<namespace>.<apps-domain>/api/metrics/v1/default"
    auth:
      type: none
      cert_file: "secret:acm-observability-certs:tls.crt"
      key_file: "secret:acm-observability-certs:tls.key"
Provides:
- HTTPS with mTLS authentication and encryption
- External access (can be accessed from outside the cluster if needed)
- RBAC enforcement via Observatorium
- Multi-tenant isolation
- Requires certificate setup
Option 2: Internal Thanos Service (HTTP)
external_services:
  prometheus:
    url: "http://observability-thanos-query-frontend.open-cluster-management-observability.svc:9090"
    auth:
      type: none
Provides:
- Simpler setup (no certificates required)
- Direct access to Thanos (potentially lower latency)
- Internal cluster networking only
- HTTP only (no encryption between Kiali and Thanos)
Recommendation: Use the Observatorium API for production environments where you want encrypted connections and proper authentication. Use internal services for development/testing environments where simplicity is preferred or where network security is already provided by the cluster infrastructure.
The rest of this guide focuses on the Observatorium API approach with mTLS authentication.
Step 1: Obtain mTLS Certificates from ACM
ACM automatically creates long-lived client certificates (1 year validity) for accessing the Observatorium API. Extract these from the hub cluster:
# Extract client certificate (for authentication)
oc get secret observability-grafana-certs \
  -n open-cluster-management-observability \
  -o jsonpath='{.data.tls\.crt}' | base64 -d > tls.crt

# Extract client key (for authentication)
oc get secret observability-grafana-certs \
  -n open-cluster-management-observability \
  -o jsonpath='{.data.tls\.key}' | base64 -d > tls.key
Note: These certificates are created automatically when ACM MultiClusterObservability is deployed and are already trusted by the Observatorium API.
ACM Version Note: Secret names may vary depending on your ACM version. Before proceeding, verify the secret exists:
oc get secrets -n open-cluster-management-observability | grep -i cert
If observability-grafana-certs doesn’t exist, look for similar secrets containing client certificates.
Extract the CA certificate that signed the Observatorium API server certificate. This is used by Kiali to validate the server’s TLS certificate.
First, identify which CA issued the server certificate:
# Get the Observatorium API route hostname
HOST=$(oc get route observatorium-api -n open-cluster-management-observability -o jsonpath='{.spec.host}')

# Check who issued the server certificate
echo | openssl s_client -connect "${HOST}:443" -servername "${HOST}" -showcerts 2>/dev/null | openssl x509 -noout -issuer
Example output:
issuer=C=US, O=Red Hat, Inc., CN=observability-server-ca-certificate
Then, extract the matching CA certificate based on the issuer CN:
If the issuer CN is observability-server-ca-certificate:
oc get secret observability-server-ca-certs \
  -n open-cluster-management-observability \
  -o jsonpath='{.data.ca\.crt}' | base64 -d > server-ca.crt
If the issuer CN is observability-client-ca-certificate:
oc get secret observability-client-ca-certs \
  -n open-cluster-management-observability \
  -o jsonpath='{.data.ca\.crt}' | base64 -d > server-ca.crt
Note: Both secrets are in the open-cluster-management-observability namespace. The exact CA used may vary depending on your ACM version and configuration.
Step 3: Create Kubernetes Resources
Note: <kiali-namespace> and ${KIALI_NAMESPACE} are used as a placeholder for the namespace where Kiali is deployed. This is commonly istio-system but is not required to be - replace with your actual Kiali namespace.
Create the mTLS certificate secret in Kiali’s namespace:
KIALI_NAMESPACE="istio-system"  # Replace with your Kiali namespace

oc create secret generic acm-observability-certs \
  -n ${KIALI_NAMESPACE} \
  --from-file=tls.crt=tls.crt \
  --from-file=tls.key=tls.key
Create the CA bundle ConfigMap in Kiali’s namespace:
oc create configmap kiali-cabundle \
  -n ${KIALI_NAMESPACE} \
  --from-file=additional-ca-bundle.pem=server-ca.crt
On OpenShift: The Kiali Operator (or Helm chart) automatically creates a separate ConfigMap named kiali-cabundle-openshift for the OpenShift service CA, then uses a projected volume to combine it with your custom kiali-cabundle ConfigMap. You only need to create/manage kiali-cabundle with your ACM CA - the system handles merging.
For more details about CA bundle configuration, see TLS Configuration.
Step 4: Get Observatorium API URL
Find the external Observatorium API route URL:
oc get route observatorium-api \
  -n open-cluster-management-observability \
  -o jsonpath='https://{.spec.host}/api/metrics/v1/default'
The URL format is: https://observatorium-api-<namespace>.<apps-domain>/api/metrics/v1/default
Using Kiali Operator (Kiali CR):
spec:
  external_services:
    prometheus:
      # Use Observatorium API route
      url: "<observatorium-api-url>"

      auth:
        type: none  # mTLS authentication at TLS layer, no Authorization header
        cert_file: "secret:acm-observability-certs:tls.crt"
        key_file: "secret:acm-observability-certs:tls.key"

      # Enable Thanos proxy mode
      thanos_proxy:
        enabled: true
        retention_period: "14d"
        scrape_interval: "5m"
Using Server Helm Chart:
OBSERVATORIUM_API_URL="$(oc get route observatorium-api -n open-cluster-management-observability -o jsonpath='https://{.spec.host}/api/metrics/v1/default')"

helm install kiali kiali-server \
  --namespace ${KIALI_NAMESPACE} \
  --set external_services.prometheus.url="${OBSERVATORIUM_API_URL}" \
  --set external_services.prometheus.auth.type="none" \
  --set external_services.prometheus.auth.cert_file="secret:acm-observability-certs:tls.crt" \
  --set external_services.prometheus.auth.key_file="secret:acm-observability-certs:tls.key" \
  --set external_services.prometheus.thanos_proxy.enabled="true" \
  --set external_services.prometheus.thanos_proxy.retention_period="14d" \
  --set external_services.prometheus.thanos_proxy.scrape_interval="5m"
Important Configuration Notes
Metrics Latency
ACM collects metrics from each cluster’s Prometheus and pushes to Thanos every 5 minutes (default). This means, by default, there is a 5-6 minute delay before new metrics appear in Kiali. This latency is inherent to ACM’s architecture and applies to all managed clusters.
Note: This interval is configurable via the spec.observabilityAddonSpec.interval field (in seconds) in the MultiClusterObservability CR on the hub cluster.
Initial warm-up period: After deploying a new application, it takes approximately twice the collection interval before data appears in Kiali’s graph and metrics tab. This is because Kiali uses PromQL rate() functions which require at least two data points to compute a result, and with ACM’s collection interval, two data points take at least two collection cycles to accumulate. For example, with the default 5-minute interval, expect a ~10-minute warm-up period. After this initial warm-up, all time ranges in Kiali should display data normally. However, keep in mind that the most recent data visible in Kiali will always be at least one collection interval old, since metrics must complete a full collection cycle before they appear in Thanos.
Thanos Proxy Mode
Enable thanos_proxy when using ACM/Thanos:
external_services:
  prometheus:
    thanos_proxy:
      enabled: true
      retention_period: "14d"  # Should match your ACM Thanos retention
      scrape_interval: "5m"   # Must match ACM's metrics collection interval
When enabled: true, Kiali uses the configured scrape_interval and retention_period values directly, rather than querying Prometheus’s /api/v1/status/config and /api/v1/status/runtimeinfo endpoints to discover them. This is necessary because Thanos does not expose these Prometheus configuration endpoints.
Why these values matter:
scrape_interval: Kiali’s UI uses this value to compute PromQL rate() intervals and query step sizes. The rate interval must be large enough to contain at least two data points for rate() to produce results. With ACM, data points arrive in Thanos at the ACM collection interval (default 5 minutes), not at the local Prometheus scrape interval (typically 15-30 seconds). If scrape_interval is set too low (e.g., “30s”), the computed rate windows will be too narrow to capture two ACM data points, causing Kiali’s metrics tab to show empty charts even though data exists in Thanos.
Critical: Set scrape_interval to match the ACM metrics collection interval (default "5m"), not the local Prometheus scrape interval. The ACM collection interval is configured via spec.observabilityAddonSpec.interval in the MultiClusterObservability CR on the hub cluster. If you have customized this value, set scrape_interval to match.
retention_period: Used to limit time range queries to available data. ACM defaults to 365d retention when spec.advanced.retentionConfig is not explicitly configured in the MultiClusterObservability CR. If using the default, set retention_period to “365d”. If configuring custom retention, use at least 10d minimum (a Thanos requirement for downsampling to function). Always match retention_period to your actual ACM retention configuration. The “14d” value shown in examples here is used for demonstration.
Multi-Cluster Setup
For multi-cluster service mesh deployments with ACM:
1. Metrics Aggregation (Handled by ACM)
ACM automatically aggregates metrics from all managed clusters. Each cluster’s metrics include a cluster label with the cluster name (the metadata.name of the ManagedCluster resource). To get a list of all the clusters managed by ACM, run oc get managedcluster on the hub cluster.
Kiali can filter metrics by cluster using query_scope. The query_scope configuration adds label filters to every Prometheus query:
external_services:
  prometheus:
    # Example 1: Filter to a single cluster
    query_scope:
      cluster: "east-cluster"

    # Example 2: Filter by mesh_id and cluster
    query_scope:
      mesh_id: "mesh-1"
      cluster: "east-cluster"
Each key-value pair in query_scope is added as key="value" to every query. For example, cluster: "east-cluster" adds cluster="east-cluster" to all PromQL queries.
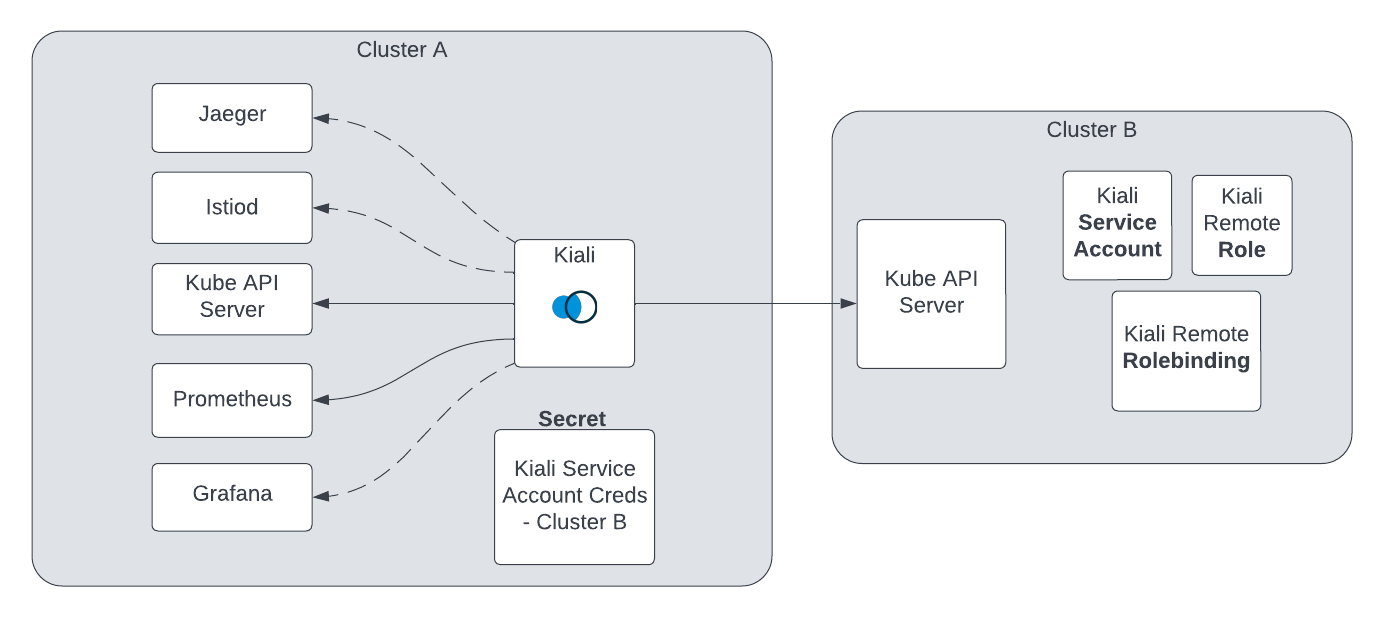
2. Remote Cluster Access (For Workload/Config Data)
While metrics come from ACM’s central Thanos, Kiali still needs direct API access to each cluster for:
- Workload and service discovery
- Istio configuration validation
- Kubernetes resource details
Create remote cluster secrets as described in the multi-cluster setup guide.
3. External Deployment Model
For multi-cluster with ACM, if you deploy Kiali on the hub cluster (or on a separate management cluster), you will typically want to run Kiali in external deployment mode:
clustering:
  ignore_home_cluster: true  # Kiali is external to mesh

kubernetes_config:
  cluster_name: "<management-cluster-name>"  # Unique name for the cluster where Kiali runs
See the External Kiali guide for complete external deployment instructions.
Certificate Management
Automatic Rotation
ACM-issued certificates (stored in the observability-grafana-certs secret in the ACM observability namespace) have 1-year validity and are automatically rotated by ACM before expiration. When certificates are rotated:
- ACM updates the
observability-grafana-certs secret in open-cluster-management-observability namespace
- You must update the
acm-observability-certs secret in Kiali’s namespace with the new certificate data. Options include:
- Kubernetes updates the mounted files in Kiali pod (within 60 seconds after the secret update)
- Kiali automatically uses new certificates on next connection (no pod restart needed)
Using Custom Certificates
If you prefer to use your own certificate infrastructure instead of ACM’s certificates:
- Generate/obtain certificates signed by a CA trusted by ACM Observatorium API
- Configure ACM to trust your CA (consult ACM documentation)
- Create the
acm-observability-certs secret with your certificates
Verification
Check Certificate Configuration
# Verify secret exists
oc get secret acm-observability-certs -n ${KIALI_NAMESPACE}

# Check certificate expiration
oc get secret acm-observability-certs -n ${KIALI_NAMESPACE} \
  -o jsonpath='{.data.tls\.crt}' | base64 -d | \
  openssl x509 -noout -enddate

# Verify CA bundle
oc get configmap kiali-cabundle -n ${KIALI_NAMESPACE} \
  -o jsonpath='{.data.additional-ca-bundle\.pem}' | \
  openssl x509 -noout -subject
Check Kiali Logs
Verify certificates are loaded successfully:
oc logs -n ${KIALI_NAMESPACE} deployment/kiali | grep -i "credential\|certificate"

# Expected output (at "info" log level):
# INF Loaded [1] valid CA certificate(s) from [/kiali-cabundle/additional-ca-bundle.pem]
#
# Additional output (at "debug" log level):
# DBG Credential file path configured: [/kiali-override-secrets/prometheus-cert/tls.crt]
# DBG Credential file path configured: [/kiali-override-secrets/prometheus-key/tls.key]
Test Metrics
- Generate mesh traffic in one of your managed clusters
- Wait for the initial warm-up period (approximately twice the ACM collection interval; default ~10 minutes) for metrics to propagate to Thanos and for enough data points to accumulate for rate calculations. The graph may appear sooner (after ~5 minutes).
- Access Kiali UI and navigate to a workload
- Verify metrics appear in the Metrics tab and traffic graph
Ambient Mode: If you are using Ambient mode:
- Ztunnel-only traffic (no waypoint): You’ll see TCP metrics and traffic edges in the graph, but HTTP details (response codes, latency) will not be available.
- Traffic through waypoints: You’ll see full L7 metrics, same as sidecar mode.
Verify Metrics in Thanos Directly
Test that metrics exist in Thanos (from within the hub cluster). The following are different queries you can run to obtain metrics data from the backend metric datastore used by ACM.
Note: These commands use jq to format JSON output. If you don’t have jq installed, simply omit | jq . to see the full, unfiltered and raw JSON.
# List available metric names (Kiali uses istio_*, pilot_*, and envoy_* metrics)
oc get --raw "/api/v1/namespaces/open-cluster-management-observability/services/http:observability-thanos-query-frontend:9090/proxy/api/v1/label/__name__/values" | jq -r '.data[] | select(startswith("istio_") or startswith("pilot_") or startswith("envoy_"))'

# Count timeseries for key Istio metrics (shows which metrics have data and how many unique timeseries)
oc get --raw "/api/v1/namespaces/open-cluster-management-observability/services/http:observability-thanos-query-frontend:9090/proxy/api/v1/query?query=count%20by%20(__name__)%20({__name__=~%22istio_requests_total|istio_tcp.*total%22})" | jq -r '.data.result[] | "\(.metric.__name__): \(.value[1])"'

# Query Istio request metrics with full details (limited to first result to show structure)
oc get --raw "/api/v1/namespaces/open-cluster-management-observability/services/http:observability-thanos-query-frontend:9090/proxy/api/v1/query?query=istio_requests_total" | jq '.data.result |= .[0:1]'
Troubleshooting
Empty Graph or No Metrics
Symptom: Kiali shows an empty graph, “No metrics” in the metrics tab, or both.
Causes and Solutions:
-
scrape_interval too low: If thanos_proxy.scrape_interval is set lower than the ACM collection interval (e.g., “30s” instead of “5m”), Kiali’s rate calculations will use windows too narrow to capture enough data points from Thanos
- Solution: Set
thanos_proxy.scrape_interval to match the ACM collection interval (default “5m”). See Thanos Proxy Mode for details
-
Still in warm-up period: After deploying a new application, it takes approximately twice the ACM collection interval (~10 minutes by default) before enough data points exist for rate calculations
- Solution: Wait for the warm-up period to elapse
-
Metrics not allowlisted: ACM doesn’t collect metrics by default
- Solution: Create
observability-metrics-custom-allowlist ConfigMap with uwl_metrics_list.yaml key in source namespace
-
PodMonitor missing: Prometheus not scraping Istio data plane components
- Solution: Create
istio-proxies-monitor PodMonitor in each mesh namespace (including the ztunnel namespace and namespaces with waypoint proxies if using Ambient mode)
-
UWM not enabled: User Workload Monitoring not configured
- Solution: Enable
enableUserWorkload: true in cluster-monitoring-config ConfigMap in openshift-monitoring namespace
-
Missing source/destination labels: The graph builds its topology from workload and namespace labels in the metrics. Verify Istio metrics have proper labels
-
Namespace not selected: Ensure the namespace is selected in the graph’s namespace dropdown
-
Query scope mismatch: Check query_scope cluster names match actual cluster label values
See also the Why is my graph empty? FAQ for additional troubleshooting information.
TLS/Certificate Errors
Symptom: Kiali logs show “x509: certificate signed by unknown authority” or “tls: bad certificate”
Solutions:
-
Verify CA bundle: Ensure kiali-cabundle ConfigMap has the correct CA
oc get configmap kiali-cabundle -n ${KIALI_NAMESPACE} -o yaml
-
Check certificate chain: Verify client cert is signed by expected CA
oc get secret acm-observability-certs -n ${KIALI_NAMESPACE} \
  -o jsonpath='{.data.tls\.crt}' | base64 -d | \
  openssl x509 -noout -issuer
-
Verify projected volume: Check both ConfigMaps are mounted
oc exec -n ${KIALI_NAMESPACE} deploy/kiali -- ls -la /kiali-cabundle/
# Should show: additional-ca-bundle.pem, service-ca.crt
Connection Refused / Timeout
Symptom: Kiali cannot reach Observatorium API
Solutions:
- Verify route exists:
oc get route observatorium-api -n open-cluster-management-observability
- Check ACM is ready (should return “True”):
oc get mco observability -o jsonpath='{.status.conditions[?(@.type=="Ready")].status}{"\n"}'
- Test connectivity (should return “OK”):
oc get --raw "/api/v1/namespaces/open-cluster-management-observability/services/http:observability-thanos-query-frontend:9090/proxy/-/ready"
- Check NetworkPolicies: Ensure no policies block egress from Kiali’s namespace
Ambient Mode: No HTTP Metrics
Symptom: Ambient mode workloads show TCP traffic in Kiali but no HTTP metrics (response codes, latency)
Possible causes:
-
No waypoint deployed: Ztunnel only provides L4 (TCP) metrics. Deploy a waypoint proxy for L7 (HTTP) visibility.
-
Missing waypoint PodMonitor: Even with a waypoint, metrics won’t be collected without a PodMonitor:
- Verify waypoint pod exists:
oc get pods -n <namespace> -l gateway.networking.k8s.io/gateway-class-name=istio-waypoint
- Create PodMonitor in the waypoint’s namespace (same config as sidecar PodMonitor)
-
Missing allowlist in waypoint namespace: Create a ConfigMap with the name observability-metrics-custom-allowlist in the namespace where the waypoint runs (see Metrics Allowlist Configuration)
Ambient Mode: No Ztunnel Metrics
Symptom: Ambient mode workloads show no traffic at all in Kiali
Possible causes:
- Missing ztunnel PodMonitor: Create
istio-proxies-monitor PodMonitor in the ztunnel namespace
- Wrong ztunnel namespace: Verify ztunnel location:
oc get pods -l app=ztunnel -A
- Missing allowlist: Create a ConfigMap with the name
observability-metrics-custom-allowlist in the ztunnel namespace (see Metrics Allowlist Configuration)
Reference
This example represents a fully configured Kiali installation using ACM Observability via the Observatorium API with mTLS:
apiVersion: kiali.io/v1alpha1
kind: Kiali
metadata:
  name: kiali
  namespace: <kiali-namespace>
spec:
  clustering:
    ignore_home_cluster: true  # External deployment

  kubernetes_config:
    cluster_name: "<management-cluster-name>"

  external_services:
    prometheus:
      url: "<observatorium-api-url>"

      auth:
        type: none
        cert_file: "secret:acm-observability-certs:tls.crt"
        key_file: "secret:acm-observability-certs:tls.key"

      thanos_proxy:
        enabled: true
        retention_period: "14d"
        scrape_interval: "5m"
Required Kubernetes resources:
---
# mTLS client certificates (from ACM)
# Data extracted from Secret observability-grafana-certs in namespace open-cluster-management-observability
apiVersion: v1
kind: Secret
metadata:
  name: acm-observability-certs
  namespace: <kiali-namespace>
type: Opaque
data:
  tls.crt: <base64-encoded-certificate>  # From observability-grafana-certs secret, tls.crt key
  tls.key: <base64-encoded-key>          # From observability-grafana-certs secret, tls.key key

---
# Server CA trust (from ACM)
# Data extracted from Secret observability-client-ca-certs (or observability-server-ca-certs) in namespace open-cluster-management-observability
apiVersion: v1
kind: ConfigMap
metadata:
  name: kiali-cabundle
  namespace: <kiali-namespace>
data:
  additional-ca-bundle.pem: |
    -----BEGIN CERTIFICATE-----
    <ACM Observability CA certificate>  # From ca.crt or tls.crt key (see Step 2 for extraction commands)
    -----END CERTIFICATE-----
Additional Resources
2 - External Kiali
Deploy Kiali on a Management Cluster.
Larger mesh deployments may desire to separate mesh operation from mesh observability. This means deploying Kiali, and potentially other observability tooling, away from the mesh.
This separation allows for:
- Dedicated management of mesh observability
- Reduced resource consumption on mesh clusters
- Centralized visibility across multiple mesh clusters
- Improved security isolation
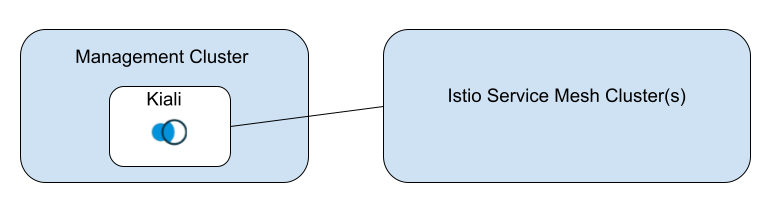
Deployment Model
This deployment model requires a minimum of two clusters. The Kiali “home” cluster (where Kiali is deployed) will serve as the “management” cluster. The “mesh” cluster(s) will be where your service mesh is deployed. The mesh deployment will still conform to any of the Istio deployment models that Kiali already supports. The fundamental difference is that Kiali will not be co-located with an Istio control plane, but instead will reside away from the mesh. For multi-cluster mesh deployments, all of the same requirements apply, such as unified metrics and traces, etc.
It can be beneficial to co-locate other observability tooling on the management cluster. For example, co-locating Prometheus will likely improve Kiali’s metric query performance, while also reducing Prometheus resource consumption on the mesh cluster(s). Although, it may require additional configuration, like federating Prometheus databases, etc.
The high-level deployment model looks like this:
Configuration
Configuring Kiali for the external deployment model has the same requirements needed for a co-located Kiali in a multi-cluster installation. Kiali still needs the necessary secrets for accessing the remote clusters.
Additionally, the configuration needs to indicate that Kiali will not be managing its home cluster. This is done in the Kiali CR by setting:
clustering:
  ignore_home_cluster: true
Kiali typically sets its home cluster name to the same cluster name set by the co-located Istio control plane. In an external deployment there is no co-located Istio control plane, and therefore the cluster name must also be set in the configuration. The name must be unique within the set of multi-cluster cluster names.
kubernetes_config:
  cluster_name: <KialiHomeClusterName>
Authorization
The external deployment model currently supports openid, openshift, and anonymous authorization strategies. token auth is untested and considered experimental.
Metrics Aggregation
For external Kiali deployments, you need a unified metrics endpoint that aggregates metrics from all mesh clusters.