Kiali connects to several external services. This section covers Prometheus, tracing and Istio dashboards, plus settings shared across those services, such as TLS.
This is the multi-page printable view of this section. Click here to print.
External Services
Configuration for Kiali’s external service integrations.
- 1: Dashboards
- 2: Metrics
- 2.1: Prometheus
- 2.2: Tuning
- 3: TLS Configuration
- 4: Tracing
1 - Dashboards
Configuration for Istio dashboard integrations.
Kiali can link to Istio dashboards hosted in Grafana or Perses.
1.1 - Grafana
This page describes how to configure Grafana dashboards for Kiali.
Grafana configuration
Istio provides preconfigured Grafana dashboards for the most relevant metrics of the mesh. Although Kiali offers similar views in its metrics dashboards, it is not in Kiali’s goals to provide the advanced querying options, nor the highly customizable settings, that are available in Grafana. Thus, it is recommended that you use Grafana if you need those advanced options.
Kiali can provide a direct link from its metric dashboards to the equivalent or most similar Grafana dashboard, which is convenient if you need the powerful Grafana options.
The Grafana links will appear in the Kiali metrics pages. For example:
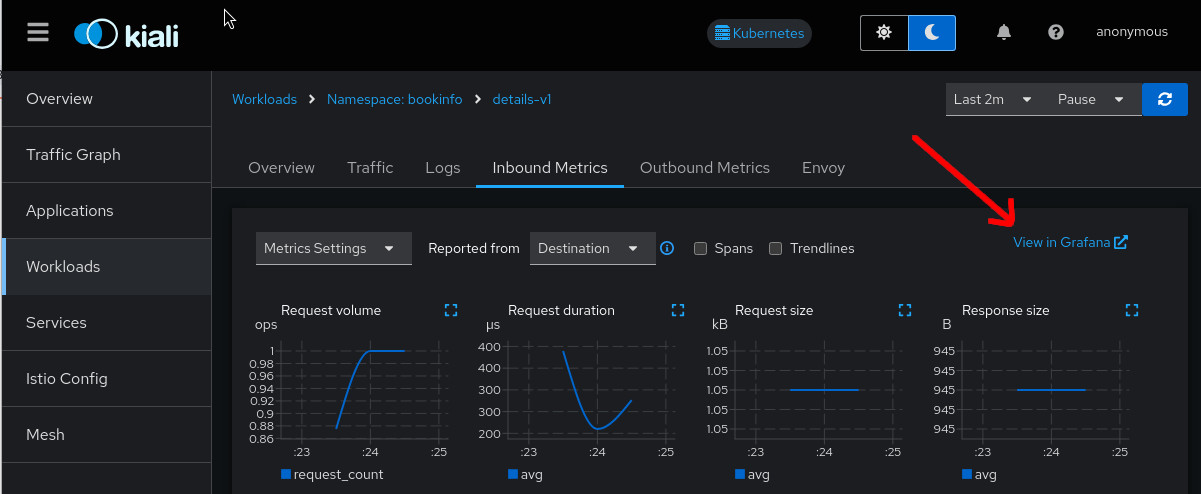
For these links to appear in Kiali you need to manually configure the Grafana URL and the dashboards that come preconfigured with Istio, like in the following example:
Kiali will query Grafana and try to fetch the configured dashboards. For this reason Kiali must be able to reach Grafana, authenticate, and find the Istio dashboards. The Istio dashboards must be installed in Grafana for the links to appear in Kiali.
spec:
  external_services:
    grafana:
      enabled: true
      # Grafana service name is "grafana" and is in the "telemetry" namespace.
      internal_url: 'http://grafana.telemetry:3000/'
      # Public facing URL of Grafana
      external_url: 'http://my-ingress-host/grafana'
      # Grafana datasource UID when there are multiple
      datasource_uid: ""
      dashboards:
      - name: "Istio Service Dashboard"
        variables:
          datasource: "var-datasource"
          namespace: "var-namespace"
          service: "var-service"
      - name: "Istio Workload Dashboard"
        variables:
          datasource: "var-datasource"
          namespace: "var-namespace"
          workload: "var-workload"
          datasource: "var-datasource"
      - name: "Istio Mesh Dashboard"
      - name: "Istio Control Plane Dashboard"
      - name: "Istio Performance Dashboard"
      - name: "Istio Wasm Extension Dashboard"
The described configuration is done in the Kiali CR when Kiali is installed using the Kiali Operator. If Kiali is installed with the Helm chart then the correct way to configure this is via regular –set flags.
Grafana authentication configuration
The Kiali CR provides authentication configuration that will be used to connect to your Grafana instance and for detecting your Grafana version in the Mesh graph.
spec:
  external_services:
    grafana:
      enabled: true
      auth:
        insecure_skip_verify: false
        password: "pwd"
        token: ""
        type: "basic"
        use_kiali_token: false
        username: "user"
      health_check_url: ""
To configure a secret to be used as a password, see this FAQ entry.
To authenticate using OAuth2 client_credentials flow, set type: "oauth2" and provide the oauth2 block:
spec:
  external_services:
    grafana:
      auth:
        type: "oauth2"
        oauth2:
          client_id: "my-client-id"
          client_secret: "secret:my-oauth2-secret:client_secret"
          token_url: "https://idp.example.com/token"
          scopes: []            # optional: list of OAuth2 scopes to request
          audience: ""          # optional: some providers require this
          auth_style: "header"  # "header" (default) or "params"
The client_secret field supports the secret:<secretName>:<secretKey> pattern for automatic secret mounting and rotation without pod restart. See the FAQ entry for details.
insecure_skip_verify applies only to the Grafana connection, not to the OAuth2 token endpoint. The token endpoint always validates TLS certificates. To trust a private CA for the token endpoint, add the CA to the kiali-cabundle ConfigMap as described in the TLS Configuration page.
TLS Certificate Configuration
If your Grafana server uses HTTPS with a certificate issued by a private CA, see the TLS Configuration page to learn how to configure Kiali to trust your CA.
1.2 - Perses
This page describes how to configure Perses dashboards for Kiali.
Perses configuration
The Perses community dashboards provide preconfigured Perses dashboards for the most relevant mesh metrics. Although Kiali offers similar views in its metrics dashboards, it is not in Kiali’s goals to provide the advanced querying options, nor the highly customizable settings, that are available in Perses. They are the same as those provided by Istio’s Grafana add-on. Thus, it is recommended that you use Perses if you need those advanced options.
Kiali, from version v2.15, can provide a direct link from its metric dashboards to the equivalent or most similar Perses dashboard, which is convenient if you need the powerful Perses options.
The Perses links will appear in the Kiali metrics pages. For example:
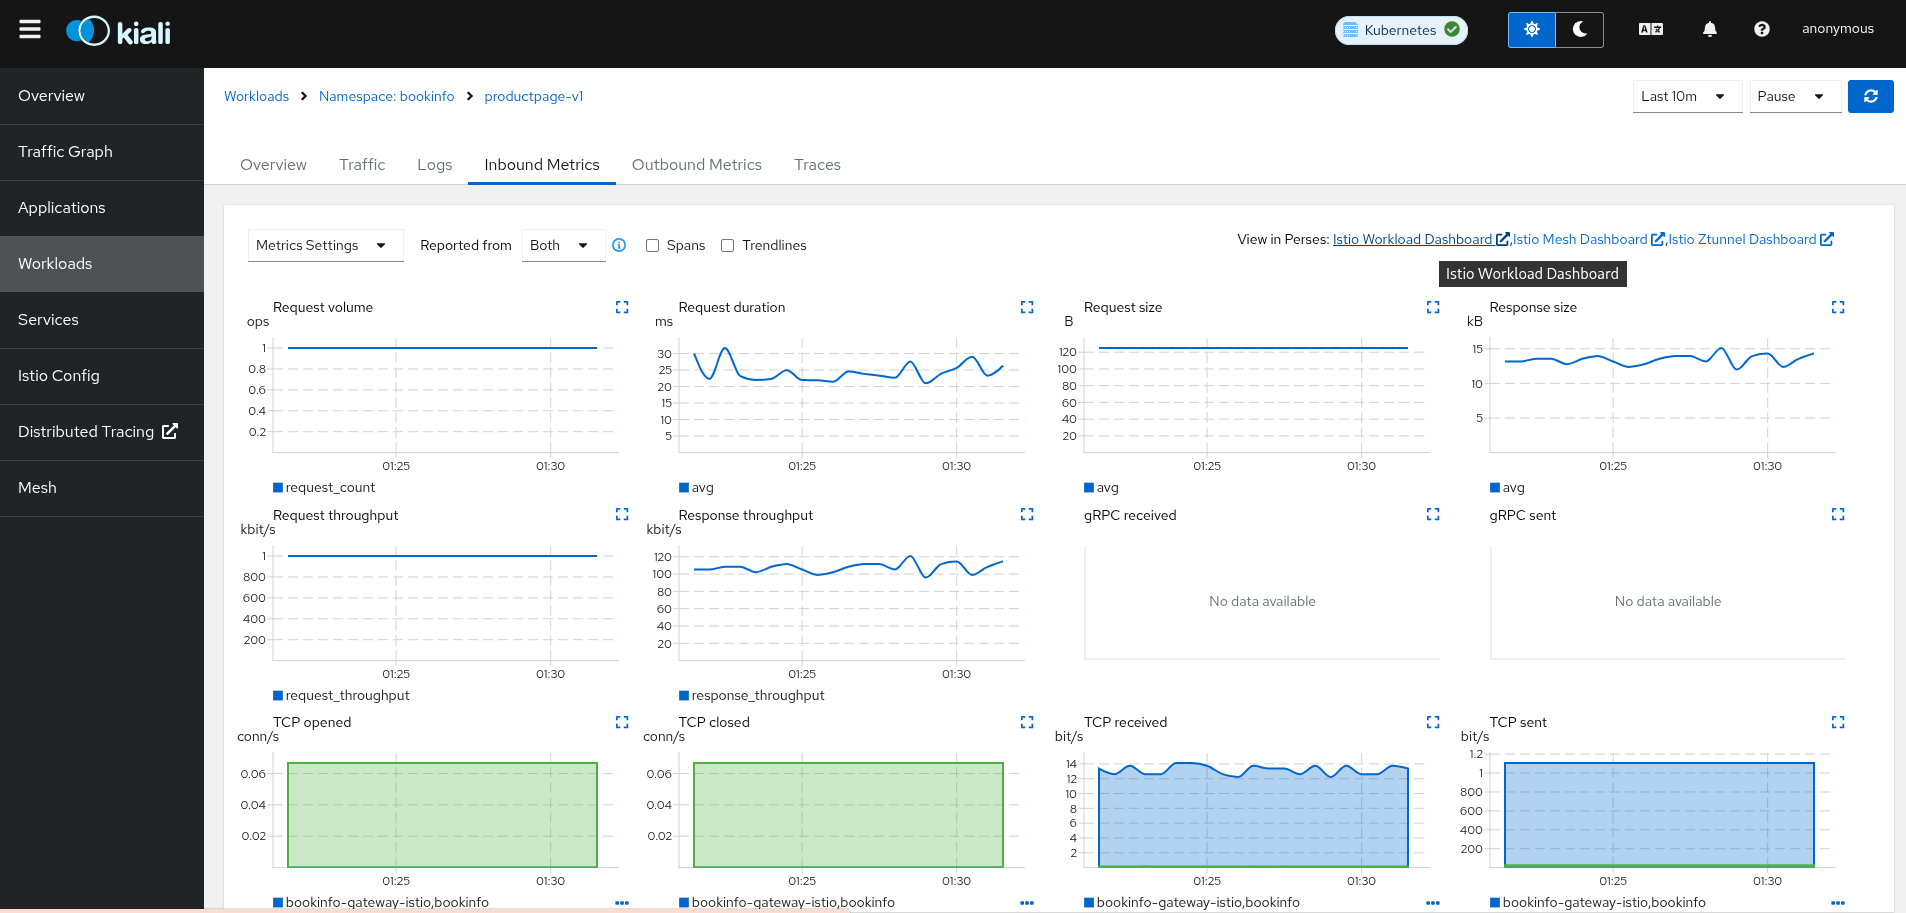
For these links to appear in Kiali you need to manually configure the Perses URL and the dashboards that come preconfigured with Istio, like in the following example:
Kiali will query Perses and try to fetch the configured dashboards. For this reason Kiali must be able to reach Perses, authenticate, and find the Istio dashboards. The Istio dashboards must be installed in Perses for the links to appear in Kiali.
spec:
  external_services:
    perses:
      enabled: true
      # Perses service name is "perses" and is in the "telemetry" namespace.
      internal_url: 'http://perses.telemetry:4000/'
      # Public facing URL of Perses
      external_url: 'http://my-ingress-host/perses'
      dashboards:
        - name: "Istio Service Dashboard"
          variables:
            namespace: "var-namespace"
            service: "var-service"
            datasource: "var-datasource"
        - name: "Istio Workload Dashboard"
          variables:
            namespace: "var-namespace"
            workload: "var-workload"
        - name: "Istio Mesh Dashboard"

        - name: "Istio Ztunnel Dashboard"
          variables:
            namespace: "var-namespace"
            workload: "var-workload"
      # Perses project
      project: "istio"
The described configuration is done in the Kiali CR when Kiali is installed using the Kiali Operator. If Kiali is installed with the Helm chart then the correct way to configure this is via regular –set flags.
When running Perses with the cluster observability operator in OpenShift, it requires an additional configuration item (Available from Kiali >2.17), so the url format can be compatible with the plugin UI URL:
spec:
  external_services:
    perses:
      ...
      url_format: "openshift"
The internal URL shouldn’t be set to avoid an internal validation of the Dashboards. The external URL should be set to the OpenShift cluster, without the additional path.
Perses authentication configuration
The Kiali CR provides authentication configuration that will be used to connect to your Perses instance and for detecting your Perses version in the Mesh graph.
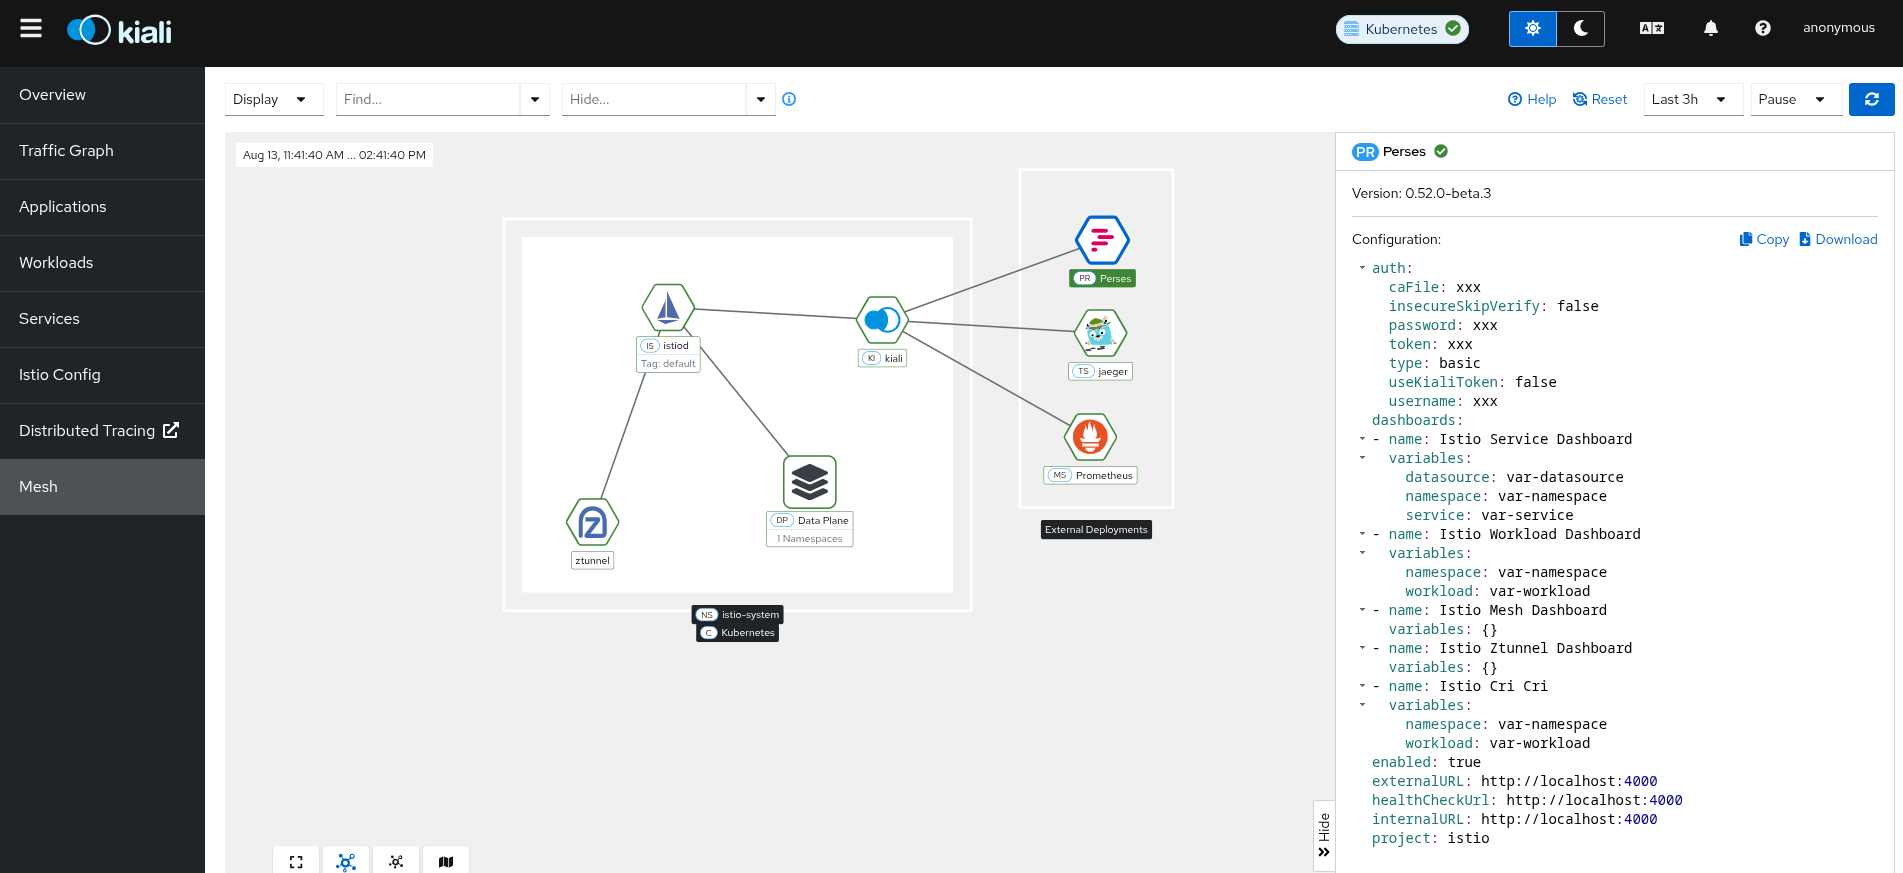
Basic and OAuth2 client_credentials authentication are supported.
spec:
  external_services:
    perses:
      enabled: true
      auth:
        insecure_skip_verify: false
        password: "pwd"
        type: "basic"
        username: "user"
      health_check_url: ""
To configure a secret to be used as a user or password, see this FAQ entry.
To authenticate using OAuth2 client_credentials flow, set type: "oauth2" and provide the oauth2 block:
spec:
  external_services:
    perses:
      auth:
        type: "oauth2"
        oauth2:
          client_id: "my-client-id"
          client_secret: "secret:my-oauth2-secret:client_secret"
          token_url: "https://idp.example.com/token"
          scopes: []            # optional: list of OAuth2 scopes to request
          audience: ""          # optional: some providers require this
          auth_style: "header"  # "header" (default) or "params"
The client_secret field supports the secret:<secretName>:<secretKey> pattern for automatic secret mounting and rotation without pod restart. See the FAQ entry for details.
insecure_skip_verify applies only to the Perses connection, not to the OAuth2 token endpoint. The token endpoint always validates TLS certificates. To trust a private CA for the token endpoint, add the CA to the kiali-cabundle ConfigMap as described in the TLS Configuration page.
TLS Certificate Configuration
If your Perses server uses HTTPS with a certificate issued by a private CA, see the TLS Configuration page to learn how to configure Kiali to trust your CA.
2 - Metrics
Configuration for metrics backends.
Kiali uses a metrics backend to power the topology graph, health calculations, and detail views. Configure the Prometheus connection on the Prometheus page and production optimizations on Tuning.
2.1 - Prometheus
This page describes how to configure Prometheus for Kiali.
Prometheus configuration
Kiali uses Prometheus to generate the topology graph, show metrics, calculate health and for several other features. Prometheus is enabled by default and is required for full Kiali functionality.
Disabling Prometheus
If you want to run Kiali without a Prometheus instance, you can disable it:
spec:
  external_services:
    prometheus:
      enabled: false
When Prometheus is disabled, Kiali will still start and serve non-metrics features such as workload/service/app listing, Istio configuration, and mesh topology. However, the graph, metrics tabs, traffic tabs, and request-rate health will be unavailable. Health badges for workloads and apps will degrade to show only Kubernetes-level status (replica counts).
The UI will display a subtle informational message reminding you that metrics features are unavailable due to your configuration choice.
When Prometheus is Unreachable
When Prometheus is enabled (the default) but Kiali cannot reach it at startup, Kiali will still start successfully with metrics features temporarily unavailable.
The UI will display a warning notification explaining why metrics are unavailable. The Prometheus component will still appear in the masthead status and the mesh topology page, reported as unhealthy, so you have clear visibility into the misconfiguration.
To restore full metrics functionality after a startup failure, fix the Prometheus connectivity issue (correct the URL, ensure the Prometheus server is running, etc.) and restart Kiali.
Configuring the Prometheus URL
By default, Kiali assumes that Prometheus is available at the URL of the form
http://prometheus.<istio_namespace_name>:9090, which is the usual case if you
are using the Prometheus Istio
add-on.
If your Prometheus instance has a different service name or is installed in a
different namespace, you must manually provide the endpoint where it is
available, like in the following example:
spec:
  external_services:
    prometheus:
      # Prometheus service name is "metrics" and is in the "telemetry" namespace
      url: "http://metrics.telemetry:9090/"
Notice that you don’t need to expose Prometheus outside the cluster. It is
enough to provide the Kubernetes internal service URL.
Kiali maintains an internal cache of some Prometheus queries to improve performance (mainly, the queries to calculate Health indicators). It would be very rare to see data delays, but should you notice any delays you may tune caching parameters to values that work better for your environment.
See the Kiali CR reference page for the current default values.
Compatibility with Prometheus-like servers
Although Kiali assumes a Prometheus server and is tested against it, there are TSDBs that can be used as a Prometheus replacement despite not implementing the full Prometheus API.
Community users have faced two issues when using Prometheus-like TSDBs:
- Kiali may report that the TSDB is unreachable, and/or
- Kiali may show empty metrics if the TSBD does not implement the
/api/v1/status/config.
To fix these issues, you may need to provide a custom health check endpoint for
the TSDB and/or manually provide the configurations that Kiali reads from the
/api/v1/status/config API endpoint:
spec:
  external_services:
    prometheus:
      # Fix the "Unreachable" metrics server warning.
      health_check_url: "http://custom-tsdb-health-check-url"
      # Fix for the empty metrics dashboards
      thanos_proxy:
        enabled: true
        retention_period: "7d"
        scrape_interval: "30s"
Prometheus tuning
For production optimization — recording rules, federation, metric thinning, scrape intervals, and retention — see Tuning.
Prometheus authentication configuration
The Kiali CR provides authentication configuration that will be used also for querying the version check to provide information in the Mesh graph.
spec:
  external_services:
    prometheus:
      auth:
        insecure_skip_verify: false
        password: "pwd"
        token: ""
        type: "basic"
        use_kiali_token: false
        username: "user"
      health_check_url: ""
To configure a secret to be used as a password, see this FAQ entry.
To authenticate using OAuth2 client_credentials flow (for example, Azure Monitor Managed Prometheus or any OAuth2-protected endpoint), set type: "oauth2" and provide the oauth2 block:
spec:
  external_services:
    prometheus:
      auth:
        type: "oauth2"
        oauth2:
          client_id: "my-client-id"
          client_secret: "secret:my-oauth2-secret:client_secret"
          token_url: "https://login.microsoftonline.com/<tenant>/oauth2/v2.0/token"
          scopes:
          - "https://prometheus.monitor.azure.com/.default"
          audience: ""          # optional: some providers require this
          auth_style: "header"  # "header" (default) or "params"
The client_secret field supports the secret:<secretName>:<secretKey> pattern for automatic secret mounting and rotation without pod restart. See the FAQ entry for details.
insecure_skip_verify applies only to the Prometheus connection, not to the OAuth2 token endpoint. The token endpoint always validates TLS certificates. To trust a private CA for the token endpoint, add the CA to the kiali-cabundle ConfigMap as described in the TLS Configuration page.
TLS Certificate Configuration
If your Prometheus server uses HTTPS with a certificate issued by a private CA, see the TLS Configuration page to learn how to configure Kiali to trust your CA.
2.2 - Tuning
Production Prometheus tuning for Kiali — recording rules, federation, metric thinning, and retention.
Production environments should not be using the Istio Prometheus add-on, or carrying over its configuration settings. That is useful only for small, or demo installations. Instead, Prometheus should have been installed in a production-oriented way, following the Prometheus documentation.
This page is primarily for users where Prometheus is being used specifically for Kiali, and possible optimizations that can be made knowing that Kiali does not utilize all of the default Istio and Envoy telemetry.
Istio and Envoy generate a large amount of telemetry for analysis and troubleshooting. This can result in significant resources being required to ingest and store the telemetry, and to support queries into the data. If you use the telemetry specifically to support Kiali, it is possible to drop unnecessary metrics and unnecessary labels on required metrics. This FAQ Entry displays the metrics and attributes required for Kiali to operate.
Option 1: Recording Rules and Federation (Recommended)
For production meshes at scale, metric thinning on a single Prometheus TSDB reduces storage somewhat but still retains per-proxy Istio series. A more efficient approach—aligned with Istio Observability Best Practices—is to:
- Aggregate using a short-lived “edge” Prometheus. Scrape your raw metrics and then use recording rules that “sum away” per-proxy labels (
pod,instance, etc.) intoworkload:*series.- “Sum away” means that several time-series will be aggregated into one, by combining those with like values for specified fields. The resulting value is the sum of the individual time-series values.
- Federate using a long-lived Federated Prometheus. Use Prometheus federation to pull the edge aggregates (plus required non-aggregated metrics) into Federated Prometheus.
- Federating will relabel the
workload:*aggregates back to standard metric names (e.g.workload:istio_requests_totalback toistio_requests_total) on Federated Prometheus so Kiali queries standard metric names.
- Federating will relabel the
Kiali already aggregates traffic at workload/service granularity in its PromQL; it does not use per-pod Istio labels. Pre-aggregated counters and histograms are therefore compatible with the traffic graph, health monitoring, and metrics tabs.
Architecture
  Edge Prometheus                         Federated Prometheus
  (scrapes Istio/Envoy)                   (long retention; Kiali queries here)
        │                                           ▲
        │  recording rules                          │  /federate
        │  istio_*  →  workload:*                   │  + relabel workload: → istio_
        │  short retention                          │
        └───────────────────────────────────────────┘
Edge Prometheus is whichever instance scrapes Istio mesh telemetry (often not the same as your platform monitoring stack). It evaluates recording rules and keeps a short retention (for example 6 hours) on raw and aggregated series.
Federated Prometheus is the long-retention TSDB Kiali should query. It federates selected series from the edge, relabels workload:* back to istio_*, and holds long retention. Both instances are production components; only Federated Prometheus is Kiali’s query target.
Configure Kiali accordingly:
The two Prometheus instances are often in different namespaces or clusters in real deployments. The Kiali repository includes a demo lab harness that co-locates both in
istio-system for learning and CI—it is not a production installer.
spec:
  external_services:
    prometheus:
      # Federated Prometheus URL — not the edge Istio scraper
      url: "http://prometheus-federated.monitoring:9090/"
If you use Istio Perses (or Grafana) dashboards with Kiali, configure them to point at the same Federated Prometheus URL.
Query target: In this pattern, external_services.prometheus.url always targets Federated Prometheus—the long-retention TSDB that holds federated mesh metrics. Edge Prometheus exists only to collect raw telemetry, evaluate recording rules, and federate upstream; it is not Kiali’s database.
kiali_* self-monitoring metrics must also end up in that Federated Prometheus TSDB, but may reach it via edge aggregation and federation or via direct scrape—see Kiali self-monitoring metrics.
Metric tiers
Federation configuration is split into tiers (metric groupings) so that Federated Prometheus pulls only needed metrics:
| Tier | Purpose | Required for |
|---|---|---|
| Core | Kiali required metrics | Traffic graph, health, lists, mesh overview |
| Istio Dashboards | Optional control-plane, perf, ztunnel, and WASM metrics | Perses Istio dashboards |
| Kiali self-monitoring | Kiali operational metrics (kiali_*) |
Kiali Internal Metrics dashboard, optional health-status alerting |
Some Perses dashboards work with the Core tier alone (Mesh, service, and workload dashboards). To ensure all of the Istio dashboards are supported, enable the Istio Dashboards tier. Enable Kiali self-monitoring when the built-in Kiali metrics dashboard or kiali_health_status alerting is needed. Note that if you define your own Kiali Custom Dashboards, you will need to ensure any required metrics are also configured for the federated Prometheus.
Production reference files
For production deployments, merge the YAML below from hack/prometheus/federation/ into your existing Prometheus configuration. These files are reference snippets—not a Kiali installer and not full deployments. Integrate them the same way you manage other Prometheus rules and scrape jobs (rule_files, ConfigMap volume mounts, PrometheusRule CRs, Helm values, etc.).
| File | Integrate into | Purpose |
|---|---|---|
core-recording-rules.yml |
Edge Prometheus (scrapes Istio/Envoy) | Recording rules producing workload:* series |
core-federation-match.yml |
Federated Prometheus federation job | Core-tier match[] selectors |
core-metrics.yml |
(reference) | Canonical core Istio metric list |
istio-dashboard-federation-match.yml |
Production federation job (optional) | Perses dashboard match[] selectors |
istio-dashboard-metrics.yml |
(reference) | Optional Istio dashboard metric list |
kiali-metrics-recording-rules.yml |
Kiali edge Prometheus (optional) | Recording rules for kiali:* series |
kiali-metrics-federation-match.yml |
Production federation job (optional) | Federation selectors for kiali:* series |
kiali-metrics.yml |
(reference) | Canonical Kiali self-monitoring metric list |
The recording rules, federation, and production checklist sections below describe how to apply these files. Optional tiers (Istio dashboards, Kiali self-monitoring) are added only when those features are enabled.
Demo lab files (not for production)
The demo/ subdirectory under the same path contains scripts and sample Kubernetes deployments for learning and CI. They patch the Istio add-on Prometheus in istio-system and deploy sample prometheus-federated / prometheus-kiali-edge instances. Do not use demo/ in production clusters—use the reference files above with your own Prometheus instead.
| File | Purpose |
|---|---|
demo/install.sh / demo/uninstall.sh |
Demo lab deploy and teardown |
demo/prometheus-federated.yaml |
Sample Federated Prometheus deployment |
demo/prometheus-kiali-edge.yaml |
Sample dedicated Kiali edge Prometheus |
demo/render-*.py, demo/merge-recording-rules.py |
Render demo manifests from the production reference YAML |
See Demo walkthrough below to try the pattern locally.
Recording rules (edge Prometheus)
Apply core-recording-rules.yml on the Prometheus instance that scrapes Istio traffic (or merge the groups into your existing rule set). The rules drop scrape/infrastructure labels (pod, pod_template_hash, instance, job, node) while preserving Istio semantic labels and the Prometheus scrape namespace label. The same without (...) shape is used in kiali-metrics-recording-rules.yml for consistency.
groups:
- name: istio.workload-aggregation
  interval: 30s
  rules:
  - record: workload:istio_requests_total
    expr: sum without (pod, pod_template_hash, instance, job, node) (istio_requests_total)
  - record: workload:istio_request_duration_milliseconds_bucket
    expr: sum without (pod, pod_template_hash, instance, job, node) (istio_request_duration_milliseconds_bucket)
  # ... remaining traffic counters and histogram components — see core-recording-rules.yml
The recording rules do not apply
rate(). Kiali applies rate() at query time with user-selected durations. Use sum without (...) rather than sum by (...) so required labels are not dropped accidentally.
How you install the rules depends on your platform—for example a rule_files entry in prometheus.yml, a ConfigMap volume mount, or a Prometheus Operator PrometheusRule CR in the namespace where edge Prometheus runs.
On OpenShift User Workload Monitoring, a cross-namespace aggregation rule needs a
dedicated namespace that is exempt from UWM label enforcement. For the ACM/MCOA
pattern used by the multicluster tutorials, use mesh-observability and add it
to namespacesWithoutLabelEnforcement in user-workload-monitoring-config on
each managed cluster. This is what allows one propagated rule to aggregate
metrics scraped in the Istio and application namespaces; it does not remove the
need for ServiceMonitor or PodMonitor resources in those namespaces.
Federation (federated Prometheus)
Add a federation scrape job to your existing long-retention federated Prometheus. Use core-federation-match.yml for the complete core-tier match[] list. Federate workload:* traffic metrics from the edge and relabel names before storage:
- job_name: istio-mesh-federate
  honor_labels: true
  metrics_path: /federate
  scrape_interval: 30s
  params:
    match[]:
      - '{__name__=~"workload:istio_requests_total"}'
      - '{__name__=~"workload:istio_request_bytes_(bucket|count|sum)"}'
      - '{__name__=~"workload:istio_request_duration_milliseconds_(bucket|count|sum)"}'
      # ... see core-federation-match.yml for the full core-tier list
  metric_relabel_configs:
  - source_labels: [__name__]
    regex: 'workload:(.*)'
    target_label: __name__
    action: replace
  static_configs:
  - targets:
    - '<edge-prometheus-host>:9090'
Set honor_labels: true on every federation scrape job. Without it, Prometheus renames conflicting labels from the federated edge with an exported_ prefix (for example destination_workload becomes exported_destination_workload). Kiali queries assume standard Istio label names (source_*, destination_*, reporter, and so on); omitting honor_labels can break the traffic graph, health, and metrics tabs even when match[] and relabel rules are correct.
Also federate non-traffic metrics that Kiali needs but does not aggregate (for example istio_build, pilot_xds, container_cpu_usage_seconds_total) directly by name—see core-metrics.yml and core-federation-match.yml.
To include Istio dashboard metrics, append the selectors from istio-dashboard-federation-match.yml to match[].
Configure network access, TLS, and authentication between Federated and Edge Prometheus according to your environment. Kiali authentication for the Federated Prometheus URL is configured separately (see Prometheus authentication configuration).
Demo walkthrough (lab only)
The demo/install.sh script is a learning and CI harness only. It does not replace the production integration above—it automates the same reference YAML against the Istio add-on Prometheus in istio-system so you can validate the pattern locally:
# From a clone of github.com/kiali/kiali, with Istio add-on Prometheus running:
./hack/prometheus/federation/demo/install.sh

# Optional: also federate Perses dashboard metrics
./hack/prometheus/federation/demo/install.sh --with-dashboards

# Optional: federate Kiali self-monitoring (shared Istio edge Prometheus)
./hack/prometheus/federation/demo/install.sh --with-kiali-metrics

# Optional: federate Kiali self-monitoring (dedicated Kiali edge Prometheus)
./hack/prometheus/federation/demo/install.sh --with-kiali-metrics --kiali-edge dedicated

# Optional: point Kiali at the demo federated Prometheus
./hack/prometheus/federation/demo/install.sh --switch-kiali

# Combine flags as needed, for example:
./hack/prometheus/federation/demo/install.sh --with-dashboards --with-kiali-metrics --switch-kiali
After install, port-forward and verify:
# Istio edge Prometheus (recording rules)
kubectl port-forward -n istio-system svc/prometheus 9091:9090

# Demo federated Prometheus (federated data; point Kiali here)
kubectl port-forward -n istio-system svc/prometheus-federated 9092:9090

# Dedicated Kiali edge (only with --kiali-edge dedicated)
kubectl port-forward -n istio-system svc/prometheus-kiali-edge 9093:9090

# Edge: workload:* aggregates
curl -s 'http://localhost:9091/api/v1/query?query=count(workload:istio_requests_total)'

# Production: istio_* and kiali_* (no workload: or kiali: prefix)
curl -s 'http://localhost:9092/api/v1/query?query=count(istio_requests_total)'
curl -s 'http://localhost:9092/api/v1/query?query=count({__name__=~"kiali_.*"})'
The Kiali Internal Metrics dashboard only works when Kiali queries federated Prometheus (--switch-kiali or external_services.prometheus.url → prometheus-federated).
Run demo/uninstall.sh for teardown.
Integration checklist
Use this checklist when integrating the production reference files into your own Prometheus stack (not the demo/ installer):
- Identify edge Prometheus—the TSDB that scrapes Istio/Envoy (may be in a
monitoringnamespace, a remote cluster, or a managed service—not necessarilyistio-system). - Merge
core-recording-rules.ymlonto the edge; set short retention on raw mesh telemetry. - Add a federation scrape job to federated Prometheus using
core-federation-match.yml. - Optionally extend
match[]with Istio dashboard-tier selectors if Istio dashboards are enabled. - If Kiali self-monitoring is enabled, choose an option from Kiali self-monitoring metrics: apply
kiali-metrics-recording-rules.ymlon the Kiali edge and federatekiali-metrics-federation-match.ymlto Federated Prometheus (Options 1–2), or scrape Kiali directly into Federated Prometheus (Option 3). - Point
external_services.prometheus.urlat federated Prometheus (and the same URL for Perses/Grafana, if using). - Validate equivalence between edge aggregates and federated data (see below).
- Tune intervals using Interval tuning below.
For multi-cluster deployments, apply the same edge → federated pattern per mesh cluster: each cluster’s Edge Prometheus scrapes local Istio/Envoy telemetry, evaluates recording rules, and federates into that cluster’s Federated Prometheus (or into a shared central Federated Prometheus, if your organization consolidates metrics that way). Kiali already supports per-cluster Prometheus URLs in multicluster configuration—set each cluster’s external_services.prometheus.url to the Federated Prometheus instance that holds that cluster’s federated mesh metrics, not the local Edge scraper.
Interval tuning
Several independent intervals affect freshness, CPU use, and the minimum time windows Kiali can use for rate() queries. Set them together—not in isolation.
| What is configured | Where configured | Setting | Role |
|---|---|---|---|
| Metric Scrape interval | Edge Prometheus | global.scrape_interval (or per-job override on Istio/Envoy targets) |
How often raw istio_* metrics are scraped |
| Recording rule interval | Edge Prometheus | interval on the rule group in core-recording-rules.yml |
How often workload:* aggregates are recomputed |
| Federation interval | Federated Prometheus | scrape_interval on the federated Prometheus federation job |
How often Prometheus pulls workload:* (and other federated series) from the edge |
| Metric retention | Edge Prometheus | storage.tsdb.retention.time |
How long raw and workload:* series are kept before expiry (short, e.g. 6h) |
| Metric retention | Federated Prometheus | storage.tsdb.retention.time |
Long-term history Kiali and dashboards query (as desired) |
Rules of thumb:
- Set all three intervals equal: edge scrape = recording rule = federation scrape.
– The recommended default is 30s/30s/30s. This is straightforward, efficient, and correct for Kiali. Evaluating rules faster than the scrape interval wastes CPU (re-sums unchanged data). Evaluating slower means
workload:*updates lag behind available raw data. Federation at the same rate ensures each federation scrape captures a freshly evaluated aggregate. - Set
scrape_timeoutbelowscrape_intervalon the federation job. – (for example25stimeout with30sinterval) so slow federation scrapes do not overlap. - Kiali minimum duration depends on the federation scrape interval alone.
– Each federation scrape produces one data point in the federated TSDB. Prometheus
rate()requires at least two data points in the range window, so the minimum useful Kiali duration is2 × federation_scrape_interval. With 30s federation, that is 60s (1m) — matching Kiali’s smallest offered duration.
Recommended settings — 30s/30s/30s:
This is a common production default (for example kube-prometheus-stack). The Kiali reference bundle uses these values:
| Setting | Recommended value | Notes |
|---|---|---|
Edge scrape_interval |
30s |
Common production baseline |
Recording rule interval |
30s |
Matches scrape; one eval per scrape cycle |
Federation scrape_interval |
30s |
Determines Kiali’s sampling rate |
Federation scrape_timeout |
25s |
Slightly less than scrape interval |
| Edge retention | 6h |
Enough for troubleshooting; raw series expire after federation |
| Minimum Kiali duration | 1m (60s) |
2 × 30s federation; Kiali’s smallest dropdown value |
Example edge rule group header and federated Prometheus federation job:
# Edge Prometheus — recording rules
groups:
- name: istio.workload-aggregation
  interval: 30s          # match 30s scrape_interval
  rules:
  - record: workload:istio_requests_total
    expr: sum without (pod, pod_template_hash, instance, job, node) (istio_requests_total)
# Federated Prometheus — federation job
- job_name: istio-mesh-federate
  scrape_interval: 30s
  scrape_timeout: 25s
  metrics_path: /federate
  # ... match[] and relabel configs
Expected freshness: with 30s/30s/30s, the three intervals run on independent, unsynchronized clocks. Worst-case staleness of the most recent data point is ~90s (three consecutive 30s waits); average staleness is ~45s. This staleness applies to each counter snapshot. Rate accuracy between consecutive federation data points is unaffected — rate() computes the slope between correctly ordered samples regardless of their absolute delay from live traffic.
When to use different intervals:
| Edge scrape | Recording rules | Federation | Min Kiali duration | When to use |
|---|---|---|---|---|
15s |
15s |
30s |
60s (1m) |
Edge also serves alerting or direct queries needing fine granularity. Doubles scrape load vs 30s; no Kiali benefit via federation. |
30s (recommended) |
30s |
30s |
60s (1m) |
Default. Efficient, straightforward. |
1m |
1m |
1m |
2m |
Very large clusters where reducing scrape load outweighs freshness. |
Istio’s own examples use interval: 5s for recording rules with a 15s scrape. That configuration was designed for their quick-start addon where the same Prometheus serves direct queries; faster rule eval keeps workload:* fresh for local consumers. In a federation architecture where no one queries the edge directly, this benefit disappears and the extra CPU is wasted.
Kiali duration dropdown:
Kiali reads globalScrapeInterval from the Prometheus at external_services.prometheus.url and filters durations to >= 2 x globalScrapeInterval. With federation, Kiali queries the federated Prometheus. If the federated Prometheus global.scrape_interval is set to 30s (matching the federation job interval), Kiali auto-detects the correct minimum duration of 60s (1m) and no additional configuration is needed.
If the federated Prometheus global.scrape_interval differs from the federation job interval (for example global.scrape_interval: 15s but the federation job runs every 30s), Kiali may offer durations shorter than the federation sampling supports. Ensure the federated Prometheus global.scrape_interval matches or exceeds the federation job’s scrape_interval.
Kiali self-monitoring metrics
Kiali can export its own Prometheus metrics (kiali_*) for performance and optional health-status monitoring. These are not Istio mesh metrics—they are not produced on the edge by Envoy, not listed in core-metrics.yml, and not part of the Istio federation tiers.
Because Kiali queries federated Prometheus, kiali_* series must ultimately be available in that same TSDB. The metric rules KEP describes three deployment options:
| Option | Kiali metrics scraped by | Before production |
|---|---|---|
| 1. Shared Istio edge | Same edge Prom as Istio/Envoy | Recording rules + federation (parallel to workload:*) |
| 2. Dedicated Kiali edge | Separate edge Prom for Kiali only | Recording rules + federation to prod |
| 3. Direct to Federated | Federated Prom directly | Raw scrape; dedup required in queries for HA |
| Config | Default | Purpose |
|---|---|---|
server.observability.metrics.enabled |
true |
Operational metrics (API, graph, cache, validation, etc.) |
server.observability.metrics.health_status.enabled |
false |
kiali_health_status gauge per entity (opt-in; higher cardinality) |
The metrics HTTP listener (port server.observability.metrics.port, default 9090) starts when either flag is true.
kiali_health_status and HA: Multiple Kiali replicas export the same gauge values for the same entities (duplicate series, not partition-of-work). With Options 1 or 2, use max without (pod, instance, …) in recording rules to deduplicate—not sum. With Option 3, apply the same dedup in alert/dashboard queries (for example max by (cluster, namespace, health_type, name) (kiali_health_status)), because raw scrape retains per-replica copies.
The built-in Kiali Internal Metrics custom dashboard queries external_services.prometheus.url and filters metrics with the Prometheus scrape namespace label (for example {namespace="istio-system", app="kiali", ...}). It only works when federated Prometheus holds the kiali_* series (via federation or direct scrape) with the namespace label retained after edge recording rules—see kiali-metrics-recording-rules.yml.
Reference files for Options 1–2: kiali-metrics-recording-rules.yml, kiali-metrics-federation-match.yml, and (for Option 2) demo/prometheus-kiali-edge.yaml. Try them in the demo walkthrough with --with-kiali-metrics and optionally --kiali-edge dedicated.
For kiali_health_status alerting on OpenShift, see the OSSM health status alerts tutorial.
Validation
Confirm that federated series match edge aggregates (on federated Prometheus, after relabel):
# Edge Prometheus
sum(rate(workload:istio_requests_total{destination_workload_namespace="bookinfo"}[5m]))

# Federated Prometheus
sum(rate(istio_requests_total{destination_workload_namespace="bookinfo"}[5m]))
Compare series counts on the edge before federation:
count({__name__="istio_requests_total"})
count({__name__="workload:istio_requests_total"})
The workload:* count should be substantially lower when workloads have been associated with multiple pods (replicas or restarts).
Option 2: Metric Thinning
If the Federation option is not possible and you are limited to a single TSDB instance, this may be helpful.
To reduce the default telemetry to only what is needed by Kiali1 users can add the following snippet to their Prometheus configuration. Because things can change with different versions, it is recommended to ensure you use the correct version of this documentation based on your Kiali/Istio version.
The metric_relabel_configs: attribute should be added under each job name defined to scrape Istio or Envoy metrics. Below we show it under the kubernetes-pods job, but you should adapt as needed. Be careful of indentation.
    - job_name: kubernetes-pods
      metric_relabel_configs:
      - action: drop
        source_labels: [__name__]
        regex: istio_agent_.*|istiod_.*|istio_build|citadel_.*|galley_.*|pilot_[^psx].*|envoy_cluster_[^u].*|envoy_cluster_update.*|envoy_listener_[^dh].*|envoy_server_[^mu].*|envoy_wasm_.*
      - action: labeldrop
        regex: chart|destination_app|destination_version|heritage|.*operator.*|istio.*|release|security_istio_io_.*|service_istio_io_.*|sidecar_istio_io_inject|source_app|source_version
Applying this configuration should reduce the number of stored metrics by about 20%, as well as reducing the number of attributes stored on many remaining metrics.
Metric Thinning with Disabled Features
The section above drops metrics unused by Kiali. As such, making those configuration changes should not negatively impact Kiali behavior in any way. But some very heavy metrics remain. These metrics can also be dropped, but their removal will impact the behavior of Kiali. This may be OK if you don’t use the affected features of Kiali, or if you are willing to sacrifice the feature for the associated metric savings. In particular, these are “Histogram” metrics. Istio is planning to make some improvements to help users better configure these metrics, but as of this writing they are still defined with fairly inefficient default “buckets”, making the number of associated time-series quite large, and the overhead of maintaining and querying the metrics, intensive. Each histogram actually is comprised of 3 stored metrics. For example, a histogram named xxx would result in the following metrics stored into Prometheus:
xxx_bucket- The most intensive metric, and is required to calculate percentile values.
xxx_count- Required to calculate ‘avg’ values.
xxx_sum- Required to calculate rates over time, and for ‘avg’ values.
When considering whether to thin the Histogram metrics, one of the following three approaches is recommended:
- If the relevant Kiali reporting is needed, keep the histogram as-is.
- If the relevant Kiali reporting is not needed, or not worth the additional metric overhead, drop the entire histogram.
- If the metric chart percentiles are not required, drop only the xxx_bucket metric. This removes the majority of the histogram overhead while keeping rate and average (non-percentile) values in Kiali.
These are the relevant Histogram metrics:
istio_request_bytes
This metric is used to produce the Request Size chart on the metric tabs. It also supports Request Throughput edge labels on the graph.
- Appending
|istio_request_bytes_.*to thedropregex above would drop all associated metrics and would prevent any request size/throughput reporting in Kiali. - Appending
|istio_request_bytes_bucketto thedropregex above, would prevent any request size percentile reporting in the Kiali metric charts.
istio_response_bytes
This metric is used to produce the Response Size chart on the metric tabs. And also supports Response Throughput edge labels on the graph
- Appending
|istio_response_bytes_.*to thedropregex above would drop all associated metrics and would prevent any response size/throughput reporting in Kiali. - Appending
|istio_response_bytes_bucketto thedropregex above would prevent any response size percentile reporting in the Kiali metric charts.
istio_request_duration_milliseconds
This metric is used to produce the Request Duration chart on the metric tabs. It also supports Response Time edge labels on the graph.
- Appending
|istio_request_duration_milliseconds_.*to thedropregex above would drop all associated metrics and would prevent any request duration/response time reporting in Kiali. - Appending
|istio_request_duration_milliseconds_bucketto thedropregex above would prevent any request duration/response time percentile reporting in the Kiali metric charts or graph edge labels.
Scrape Interval
The Prometheus globalScrapeInterval is an important configuration option2. The scrape interval can have a significant effect on metrics collection overhead as it takes effort to pull all of those configured metrics and update the relevant time-series. And although it doesn’t affect time-series cardinality, it does affect storage for the data-points, as well as having impact when computing query results (the more data-points, the more processing and aggregation).
Users should think carefully about their configured scrape interval. Note that the Istio addon for prometheus configures it to 15s. This is great for demos but may be too frequent for production scenarios. The prometheus helm charts set a default of 1m, which is more reasonable for most installations, but may not be the desired frequency for any particular setup.
The recommendation for Kiali is to set the longest interval possible, while still providing a useful granularity. The longer the interval the less data points scraped, thus reducing processing, storage, and computational overhead. But the impact on Kiali should be understood. It is important to realize that request rates (or byte rates, message rates, etc) require a minumum of two data points:
rate = (dp2 - dp1) / timePeriod
That means for Kiali to show anything useful in the graph, or anywhere rates are used (many places), the minimum duration must be >= 2 x globalScrapeInterval. Kiali will eliminate invalid Duration options given the globalScrapeInterval.
Kiali does a lot of aggregation and querying over time periods. As such, the number of data points will affect query performance, especially for larger time periods.
For more information, see the Prometheus documentation.
TSDB retention time
The Prometheus tsdbRetentionTime is an important configuration option. It has a significant effect on metrics storage, as Prometheus will keep each reported data-point for that period of time, performing compaction as needed. The larger the retention time, the larger the required storage. Note also that Kiali queries against large time periods, and very large data-sets, may result in poor performance or timeouts.
The recommendation for Kiali is to set the shortest retention time that meets your needs and/or operational limits. In some cases users may want to offload older data to a secondary store. Kiali will eliminate invalid Duration options given the tsdbRetentionTime.
For more information, see the Prometheus documentation.
-
Some non-essential telemetry remains in order to not over-complicate the configuration change. The remaining telemetry is typically negligible. ↩︎
-
Note that Prometheus can be configured such that individual scrape points can override the global setting, but Kiali is not currently concerned with this corner case. ↩︎
3 - TLS Configuration
This page describes how to configure TLS certificates for Kiali’s connections to external services.
Overview
When Kiali connects to external services (Prometheus, Grafana, Jaeger/Tempo, Perses) over HTTPS, it needs to verify the TLS certificates presented by those services. By default, Kiali trusts the system certificate authorities (CAs) that are built into the container image.
If your external services use certificates issued by a private CA (such as an internal corporate CA, a service mesh CA, or self-signed certificates), you need to configure Kiali to trust those additional CAs.
Adding Custom Certificate Authorities
Kiali uses a global CA bundle mechanism to trust additional certificate authorities. All custom CAs are added to a single certificate pool that applies to all HTTPS connections Kiali makes to external services.
On Kubernetes
To add custom CAs, create a ConfigMap named <kiali-instance-name>-cabundle in the Kiali namespace. The default instance name is kiali, so the ConfigMap would be named kiali-cabundle:
apiVersion: v1
kind: ConfigMap
metadata:
  name: kiali-cabundle
  namespace: istio-system  # Or your Kiali namespace
data:
  additional-ca-bundle.pem: |
    -----BEGIN CERTIFICATE-----
    MIIDxTCCAq2gAwIBAgIQAqxcJmoLQ...
    ... (your CA certificate) ...
    -----END CERTIFICATE-----
    -----BEGIN CERTIFICATE-----
    MIIDyTCCArGgAwIBAgIRAJ4K...
    ... (additional CA certificates if needed) ...
    -----END CERTIFICATE-----
Key name: The key must be additional-ca-bundle.pem. You can include multiple CA certificates in PEM format in the same file.
Alternative keys: You can also use openid-server-ca.crt or (on OpenShift) oauth-server-ca.crt as key names. While these names suggest specific purposes, all CAs are loaded into Kiali’s global certificate pool and trusted for all TLS connections. Using additional-ca-bundle.pem is recommended for clarity.
For OpenShift OAuth authentication: On OpenShift, you can alternatively create a separate ConfigMap named <instance-name>-oauth-cabundle with the key oauth-server-ca.crt. See the OpenShift authentication documentation for details. However, adding your CA to kiali-cabundle under additional-ca-bundle.pem achieves the same result.
On OpenShift
On OpenShift, the Kiali Operator automatically creates a ConfigMap named <kiali-instance-name>-cabundle-openshift (e.g., kiali-cabundle-openshift) with the annotation service.beta.openshift.io/inject-cabundle: "true". This tells OpenShift to automatically inject the cluster’s service CA into the ConfigMap.
This means that by default, Kiali on OpenShift already trusts:
- The system CAs
- The OpenShift service CA (used by services with serving certificates)
If you need to add additional CAs beyond the OpenShift service CA, create a separate ConfigMap named <kiali-instance-name>-cabundle (e.g., kiali-cabundle):
apiVersion: v1
kind: ConfigMap
metadata:
  name: kiali-cabundle
  namespace: istio-system  # Or your Kiali namespace
data:
  additional-ca-bundle.pem: |
    -----BEGIN CERTIFICATE-----
    MIIDxTCCAq2gAwIBAgIQAqxcJmoLQ...
    ... (your CA certificate) ...
    -----END CERTIFICATE-----
The operator uses a projected volume that automatically combines both ConfigMaps, so your custom CAs work alongside the OpenShift service CA.
How It Works
When Kiali starts, it loads certificates from:
- System certificate pool: The default trusted CAs from the container’s operating system
- Additional CA bundle: Certificates from
/kiali-cabundle/additional-ca-bundle.pem(if present) - OpenShift service CA (OpenShift only): Certificates from
/kiali-cabundle/service-ca.crt(automatically injected from the<instance-name>-cabundle-openshiftConfigMap) - OpenID server CA (OpenID auth only): Certificates from
/kiali-cabundle/openid-server-ca.crt(if present) - OAuth CA bundle (OpenShift with OAuth auth): Certificates from
/kiali-cabundle/oauth-server-ca.crt(if the<instance-name>-oauth-cabundleConfigMap exists)
All these certificates are combined into a single certificate pool used for all HTTPS connections to external services.
On OpenShift: The operator uses a projected volume that automatically combines multiple ConfigMap sources (
<instance-name>-cabundle-openshift, <instance-name>-cabundle, and <instance-name>-oauth-cabundle) into the /kiali-cabundle mount path. This means you don’t need to manually merge ConfigMaps - each ConfigMap can be managed independently.
Automatic refresh: Kiali watches CA bundle files for changes using filesystem notifications (fsnotify) and automatically refreshes the certificate pool without requiring a pod restart. When you update the ConfigMap, Kubernetes propagates the changes to the mounted volume based on the kubelet’s sync interval (default: 60 seconds). Once the files are updated on disk, Kiali detects and applies them immediately. Total propagation time is typically 0-90 seconds after the ConfigMap update.
Skipping Certificate Verification
If you need to temporarily skip certificate verification (for testing purposes only), you can set insecure_skip_verify: true in the authentication configuration for each external service:
spec:
  external_services:
    prometheus:
      auth:
        insecure_skip_verify: true
    grafana:
      auth:
        insecure_skip_verify: true
    tracing:
      auth:
        insecure_skip_verify: true
Security warning: Disabling certificate verification makes Kiali vulnerable to man-in-the-middle attacks. Only use this option for testing purposes, never in production.
Common Scenarios
Internal Corporate CA
If your organization has an internal CA that issues certificates for internal services:
- Obtain the root CA certificate (public part only) from your security team
- Create the ConfigMap with the CA certificate as shown above
Self-Signed Certificates
For development or testing environments using self-signed certificates:
- Export the certificate from your service (usually the same certificate that was generated)
- Create the ConfigMap with that certificate
Istio Service Mesh mTLS
If your external services are part of the Istio service mesh and use Istio’s mTLS:
- Kiali typically accesses these services through their Kubernetes service names, which may bypass the sidecar
- If you need to go through the mesh, you may need to add Istio’s root CA to the bundle
cert-manager Issued Certificates
If you use cert-manager with a private CA:
- The CA certificate is typically stored in a Secret (e.g.,
my-ca-secretwith keyca.crt) - Extract the CA and add it to the ConfigMap:
kubectl get secret my-ca-secret -n cert-manager -o jsonpath='{.data.ca\.crt}' | base64 -d > ca.crt
kubectl create configmap kiali-cabundle -n istio-system --from-file=additional-ca-bundle.pem=ca.crt
Troubleshooting
Certificate Errors in Logs
If you see errors like x509: certificate signed by unknown authority in Kiali logs:
- Verify the ConfigMap exists and has the correct name
- Check that the key is exactly
additional-ca-bundle.pem - Ensure the certificate is in valid PEM format
- Verify the CA certificate is the correct one (the root or intermediate CA that signed the service’s certificate)
Verifying the ConfigMap is Mounted
Check that the ConfigMap is properly mounted in the Kiali pod:
kubectl exec -n istio-system deploy/kiali -- ls -la /kiali-cabundle/
You should see your CA bundle file listed.
Testing Certificate Chain
To verify your CA certificate is correct, you can test it outside of Kiali:
# Get the server's certificate chain
openssl s_client -connect prometheus.istio-system:9090 -showcerts

# Verify against your CA
openssl verify -CAfile your-ca.pem server-cert.pem
4 - Tracing
Configuration for distributed tracing backends.
Kiali integrates with distributed tracing platforms to enhance mesh observability.
4.1 - Jaeger
This page describes how to configure Jaeger for Kiali.
Jaeger configuration
Jaeger is a highly recommended service because Kiali uses distributed tracing data for several features, providing an enhanced experience.
By default, Kiali will try to reach Jaeger at the GRPC-enabled URL of the form
http://tracing.<istio_namespace_name>:16685/jaeger, which is the usual case
if you are using the Jaeger Istio
add-on.
If this endpoint is unreachable, Kiali will disable features that use
distributed tracing data.
If your Jaeger instance has a different service name or is installed to a different namespace, you must manually provide the endpoint where it is available, like in the following example:
spec:
  external_services:
    tracing:
      # Enabled by default. Kiali will anyway fallback to disabled if
      # Jaeger is unreachable.
      enabled: true
      # Jaeger service name is "tracing" and is in the "telemetry" namespace.
      # Make sure the URL you provide corresponds to the non-GRPC enabled endpoint
      # if you set "use_grpc" to false.
      internal_url: "http://tracing.telemetry:16685/jaeger"
      use_grpc: true
      # Public facing URL of Jaeger
      external_url: "http://my-jaeger-host/jaeger"
Minimally, you must provide spec.external_services.tracing.internal_url to
enable Kiali features that use distributed tracing data. However, Kiali can
provide contextual links that users can use to jump to the Jaeger console to
inspect tracing data more in depth. For these links to be available you need to
set the spec.external_services.tracing.external_url to the URL where you
expose Jaeger outside the cluster.
Default values for connecting to Jaeger are based on the Istio’s provided
sample add-on manifests.
If your Jaeger setup differs significantly from the sample add-ons, make sure
that Istio is also properly configured to push traces to the right URL.
Jaeger authentication configuration
The Kiali CR provides authentication configuration that will be used also for querying the version check to provide information in the Mesh graph.
spec:
  external_services:
    tracing:
      enabled: true
      auth:
        insecure_skip_verify: false
        password: "pwd"
        token: ""
        type: "basic"
        use_kiali_token: false
        username: "user"
      health_check_url: ""
To configure a secret to be used as a password, see this FAQ entry.
To authenticate using OAuth2 client_credentials flow, set type: "oauth2" and provide the oauth2 block:
spec:
  external_services:
    tracing:
      use_grpc: false           # must be false; oauth2 token injection is not implemented for gRPC transport
      auth:
        type: "oauth2"
        oauth2:
          client_id: "my-client-id"
          client_secret: "secret:my-oauth2-secret:client_secret"
          token_url: "https://idp.example.com/token"
          scopes: []            # optional: list of OAuth2 scopes to request
          audience: ""          # optional: some providers require this
          auth_style: "header"  # "header" (default) or "params"
OAuth2 authentication requires
use_grpc: false. OAuth2 token injection is not implemented for gRPC transport.
insecure_skip_verify applies only to the Jaeger connection, not to the OAuth2 token endpoint. The token endpoint always validates TLS certificates. To trust a private CA for the token endpoint, add the CA to the kiali-cabundle ConfigMap as described in the TLS Configuration page.
The client_secret field supports the secret:<secretName>:<secretKey> pattern for automatic secret mounting and rotation without pod restart. See the FAQ entry for details.
TLS Certificate Configuration
If your Jaeger server uses HTTPS with a certificate issued by a private CA, see the TLS Configuration page to learn how to configure Kiali to trust your CA.
4.2 - Tempo
This page describes how to configure Grafana Tempo for Kiali.
- Grafana Tempo Configuration
- Configuration table
- Tempo tuning
- Tempo cache
- Tempo authentication configuration
Grafana Tempo Configuration
There are two possibilities to integrate Kiali with Grafana Tempo:
- Using the Grafana Tempo API: This option returns the traces from the Tempo API in OpenTelemetry format.
- Using the Jaeger frontend with the Grafana Tempo backend.
- Appendix: Configuration table
Using the Grafana Tempo API
There are two steps to set up Kiali and Grafana Tempo:
- Set up the Kiali CR updating the Tracing and Grafana sections.
- Set up a Tempo data source in Grafana.
Set up the Kiali CR
This is a configuration example to set up Kiali tracing with Grafana Tempo:
spec:
  external_services:
    tracing:
      # Enabled by default. Kiali will anyway fallback to disabled if
      # Tempo is unreachable.
      enabled: true
      health_check_url: "https://tempo-instance.grafana.net"
      # Tempo service name is "query-frontend" and is in the "tempo" namespace.
      # Make sure the URL you provide corresponds to the non-GRPC enabled endpoint
      # It does not support grpc yet, so make sure "use_grpc" is set to false.
      internal_url: "http://tempo-tempo-query-frontend.tempo.svc.cluster.local:3200/"
      provider: "tempo"
      tempo_config:
        org_id: "1"
        datasource_uid: "a8d2ef1c-d31c-4de5-a90b-e7bc5252cd00"
        url_format: "grafana"
      use_grpc: false
      # Public facing URL of Tempo
      external_url: "https://grafana-istio-system.apps-crc.testing/"
Kiali uses the external_url to construct “View in tracing” links in the UI. For the Tempo provider the default url_format is grafana. So, by default the URL will have the Grafana UI format when linking to specific services and traces.
It is also possible to set url_format to openshift. In this case the URL will redirect to the UI Plugin in the OpenShift console. When it is set to openshift, there are other settings as well:
spec:
  external_services:
    tracing:
      tempo_config:
        name: "sample"
        namespace: "tempo"
        tenant: "default"
        url_format: "openshift"
When the tenant is specified, if internal_url doesn’t have a path, it will be autocompleted with the Tempo path. For this example:
internal_url: https://tempo-sample-gateway.tempo.svc.cluster.local:8080/
Will be autocompleted to: https://tempo-sample-gateway.tempo.svc.cluster.local:8080/api/traces/v1/{tenant}/tempo
The other valid option for url_format is jaeger, used when the Jaeger UI is available in Tempo.
Set up a Tempo Datasource in Grafana
We can optionally set up a default Tempo datasource in Grafana so that you can view the Tempo tracing data within the Grafana UI, as you see here:
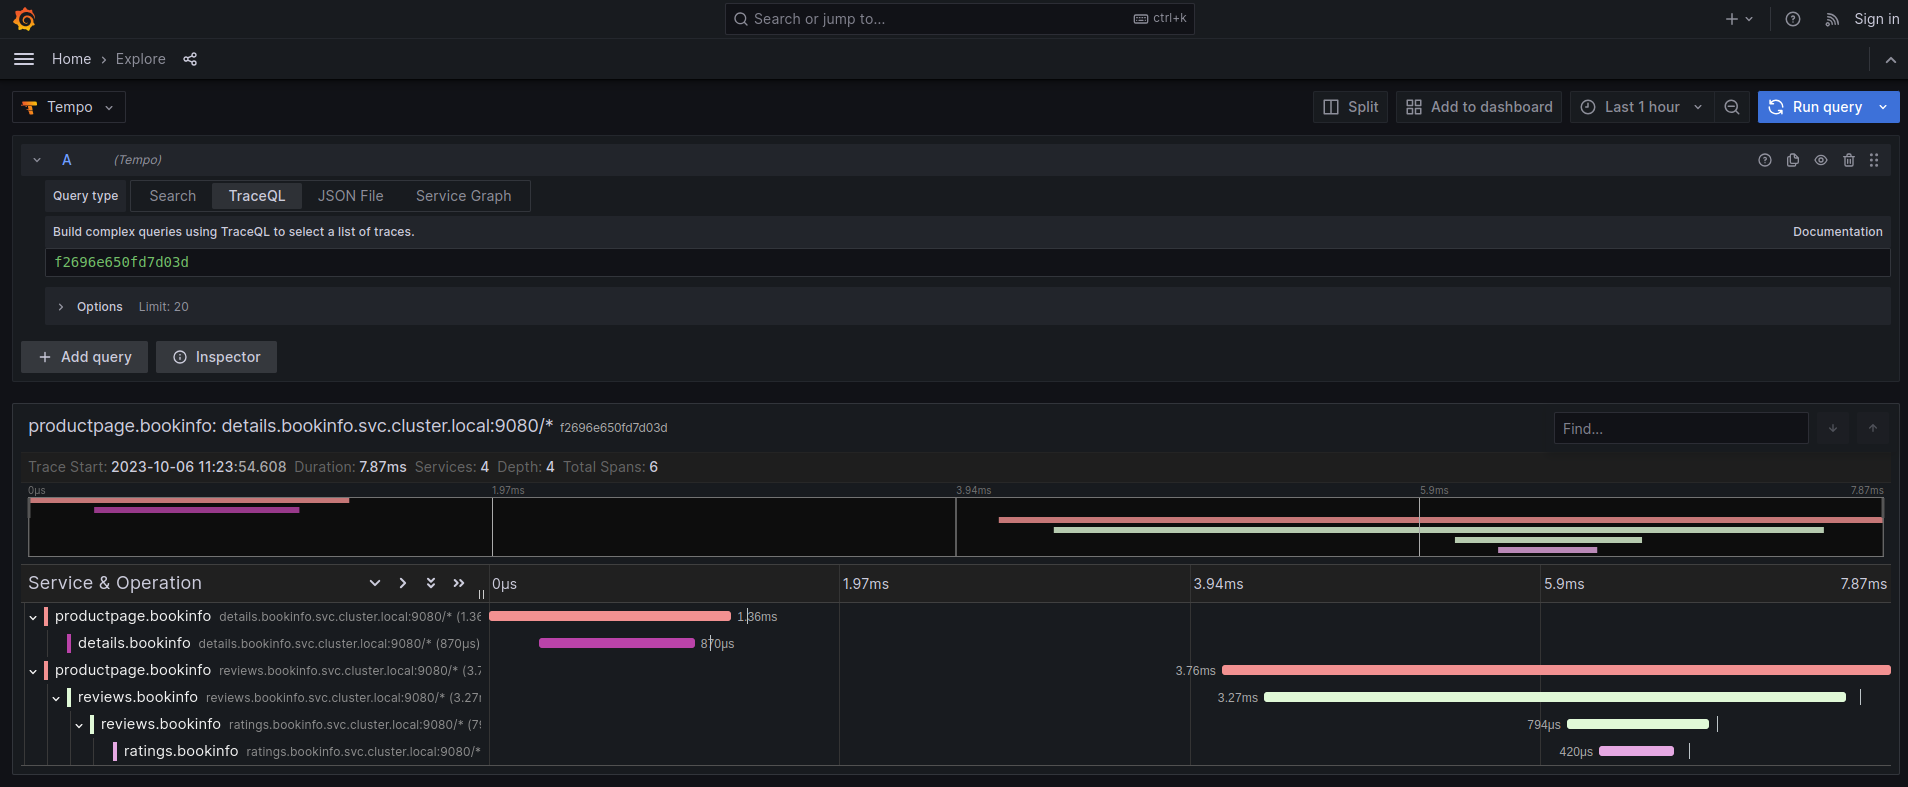
To set up the Tempo datasource, go to the Home menu in the Grafana UI, click Data sources, then click the Add new data source button and select the Tempo data source. You will then be asked to enter some data to configure the new Tempo data source:
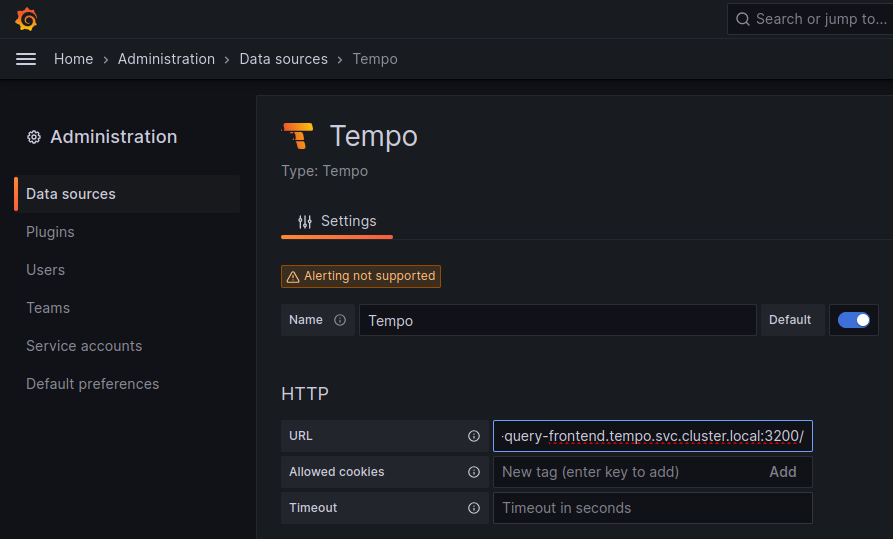
The most important values to set up are the following:
- Mark the data source as default, so the URL that Kiali uses will redirect properly to the Tempo data source.
- Update the HTTP URL. This is the internal URL of the HTTP tempo frontend service. e.g.
http://tempo-tempo-query-frontend.tempo.svc.cluster.local:3200/
Additional configuration
The Traces tab in the Kiali UI will show your traces in a bubble chart:
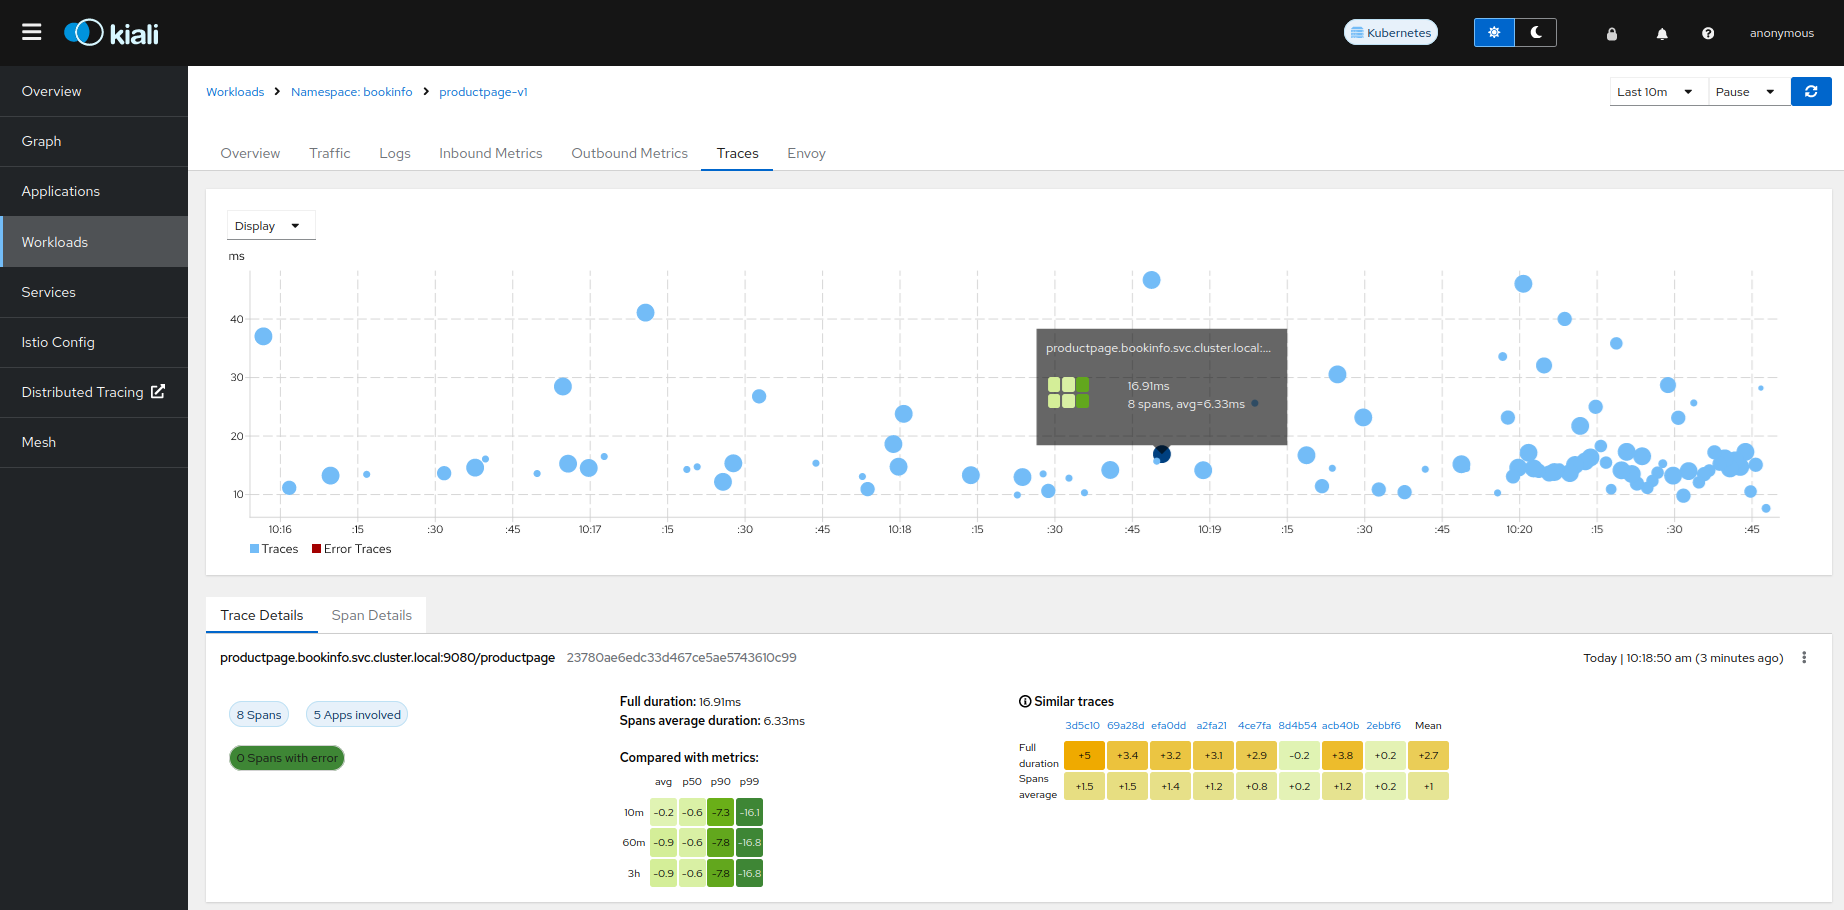
Increasing performance is achievable by enabling gRPC access, specifically for query searches. However, accessing the HTTP API will still be necessary to gather information about individual traces. This is an example to configure the gRPC access:
spec:
  external_services:
    tracing:
      enabled: true
      # grpc port defaults to 9095
      grpc_port: 9095
      internal_url: "http://query-frontend.tempo:3200"
      provider: "tempo"
      use_grpc: true
      external_url: "http://my-tempo-host:3200"
Service check URL
By default, Kiali will check the service health in the endpoint /status/services, but sometimes, this is exposed in a different url, which can lead to a component unreachable message:
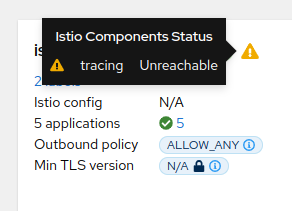
This can be changed with the health_check_url configuration option.
spec:
  external_services:
    tracing:
      health_check_url: "http://query-frontend.tempo:3200"
Configuration for the Grafana Tempo Datasource
In order to correctly redirect Kiali to the right Grafana Tempo Datasource, there are a couple of configuration options to update:
spec:
  external_services:
    tracing:
      tempo_config:
        org_id: "1"
        datasource_uid: "a8d2ef1c-d31c-4de5-a90b-e7bc5252cd00"
org_id is usually not needed since “1” is the default value which is also Tempo’s default org id.
The datasource_uid needs to be updated in order to redirect to the right datasource in Grafana versions 10 or higher.
Using the Jaeger frontend with Grafana Tempo tracing backend
It is possible to use the Grafana Tempo tracing backend exposing the Jaeger API. tempo-query is a Jaeger storage plugin. It accepts the full Jaeger query API and translates these requests into Tempo queries.
Since Tempo is not yet part of the built-in addons that are part of Istio, you need to manage your Tempo instance.
Tanka
The official Grafana Tempo documentation explains how to deploy a Tempo instance using Tanka. You will need to tweak the settings from the default Tanka configuration to:
- Expose the Zipkin collector
- Expose the GRPC Jaeger Query port
When the Tempo instance is deployed with the needed configurations, you have to
set
meshConfig.defaultConfig.tracing.zipkin.address
from Istio to the Tempo Distributor service and the Zipkin port. Tanka will deploy
the service in distributor.tempo.svc.cluster.local:9411.
The external_services.tracing.internal_url Kiali option needs to be set to:
http://query-frontend.tempo.svc.cluster.local:16685.
Tempo Operator
The Tempo Operator for Kubernetes provides a native Kubernetes solution to deploy Tempo easily in your system.
After installing the Tempo Operator in your cluster, you can create a new Tempo instance with the following CR:
kubectl create namespace tempo
kubectl apply -n tempo -f - <<EOF
apiVersion: tempo.grafana.com/v1alpha1
kind: TempoStack
metadata:
  name: smm
spec:
  storageSize: 1Gi
  storage:
    secret:
      type: s3
      name: object-storage
  template:
    queryFrontend:
      component:
        resources:
          limits:
            cpu: "2"
            memory: 2Gi
      jaegerQuery:
        enabled: true
        ingress:
          type: ingress
EOF
Note the name of the bucket where the traces will be stored in our example is
called object-storage. Check the
Tempo Operator
documentation to know more about what storages are supported and how to create
the secret properly to provide it to your Tempo instance.
Now, you are ready to configure the
meshConfig.defaultConfig.tracing.zipkin.address
field in your Istio installation. It needs to be set to the 9411 port of the
Tempo Distributor service. For the previous example, this value will be
tempo-smm-distributor.tempo.svc.cluster.local:9411.
Now, you need to configure the internal_url setting from Kiali to access
the Jaeger API. You can point to the 16685 port to use GRPC or 16686 if not.
For the given example, the value would be
http://tempo-ssm-query-frontend.tempo.svc.cluster.local:16685.
There is a related tutorial with detailed instructions to setup Kiali and Grafana Tempo with the Operator.
Configuration table
Supported versions
Kiali Version |
Jaeger |
Tempo |
Tempo with JaegerQuery |
|---|---|---|---|
| <= 1.79 (OSSM 2.5) | ✅ | ❌ | ✅ |
| > 1.79 | ✅ | ✅ | ✅ |
Minimal configuration for Kiali <= 1.79
In external_services.tracing
http |
grpc |
|
|---|---|---|
| Jaeger | .internal_url = 'http://jaeger_service_url:16686/jaeger'.use_grpc = false |
.internal_url = 'http://jaeger_service_url:16685/jaeger'.use_grpc = true (Not required: by default) |
| Tempo | .internal_url = 'http://query_frontend_url:16686'.use_grpc = false |
.internal_url = 'http://query_frontend_url:16685' .use_grpc = true (Not required: by default) |
Minimal configuration for Kiali > 1.79
http |
grpc |
|
|---|---|---|
| Jaeger | .internal_url = 'http://jaeger_service_url:16686/jaeger'.use_grpc = false |
.internal_url = 'http://jaeger_service_url:16685/jaeger' .use_grpc = true (Not required: by default) |
| Tempo | internal_url = 'http://query_frontend_url:3200'.use_grpc = false.provider = 'tempo' |
.internal_url = 'http://query_frontend_url:3200'.grpc_port: 9095 .provider: 'tempo'.use_grpc = true (Not required: by default) |
Tempo tuning
Resources consumption
Grafana Tempo is a powerful tool, but it can lead to performance issues when not configured correctly. For example, the following configuration is not recommended and may lead to OOM issues for simple queries in the query-frontend component:
spec:
  resources:
    total:
      limits:
        memory: 2Gi
        cpu: 2000m
These resources are shared between all the Tempo components. When needed, apply resources to each specific component, instead of applying the resources globally:
spec:
  template:
    queryFrontend:
      component:
        resources:
          limits:
            cpu: "2"
            memory: 2Gi
This Grafana Dashboard is available to measure the resources used in the tempo namespace.
Caching
Tempo offers multi-level caching that is used by default with Tanka and Helm deployment examples. It uses external cache, supporting Memcached and Redis. The lower level cache has a higher hit rate, and caches bloom filters and parquet data. The higher level caches frontend-search data.
Optimizing the cache depends on the application usage, and can be done modifying different parameters:
- Connection limit for MemCached: Should be increased in large deployments, as MemCached is set to 1024 by default.
- Cache size control: Should be increased when the working set is larger than the size of cache.
Tune search pipeline
There are many parameters to tune the search pipeline, some of these:
- max_concurrent_queries: If it is too high it can cause OOM.
- concurrent_jobs: How many jobs are done concurrently.
- max_retries: When it is too high it can result in a lot of load.
Dedicated attribute columns
When using the vParquet3 storage format , defining dedicated attribute columns can improve the query performance. In order to best choose those columns (Up to 10), a good criteria is to choose attributes that contribute growing the block size (And not those commonly used).
Tempo authentication configuration
The Kiali CR provides authentication configuration that will be used also for querying the version check to provide information in the Mesh graph.
spec:
  external_services:
    tracing:
      enabled: true
      auth:
        insecure_skip_verify: false
        password: "pwd"
        token: ""
        type: "basic"
        use_kiali_token: false
        username: "user"
      health_check_url: ""
To configure a secret to be used as a password, see this FAQ entry.
To authenticate using OAuth2 client_credentials flow, set type: "oauth2" and provide the oauth2 block:
spec:
  external_services:
    tracing:
      use_grpc: false           # must be false; oauth2 token injection is not implemented for gRPC transport
      auth:
        type: "oauth2"
        oauth2:
          client_id: "my-client-id"
          client_secret: "secret:my-oauth2-secret:client_secret"
          token_url: "https://idp.example.com/token"
          scopes: []            # optional: list of OAuth2 scopes to request
          audience: ""          # optional: some providers require this
          auth_style: "header"  # "header" (default) or "params"
OAuth2 authentication requires
use_grpc: false. OAuth2 token injection is not implemented for gRPC transport.
insecure_skip_verify applies only to the Tempo connection, not to the OAuth2 token endpoint. The token endpoint always validates TLS certificates. To trust a private CA for the token endpoint, add the CA to the kiali-cabundle ConfigMap as described in the TLS Configuration page.
The client_secret field supports the secret:<secretName>:<secretKey> pattern for automatic secret mounting and rotation without pod restart. See the FAQ entry for details.
TLS Certificate Configuration
If your Tempo server uses HTTPS with a certificate issued by a private CA, see the TLS Configuration page to learn how to configure Kiali to trust your CA.
Tempo cache
Kiali 2.2 includes a simple tracing cache for Tempo that stores the last N traces. By default, it is enabled and it keeps the last 200 traces. It can be modified in the Kiali CR with:
spec:
  external_services:
    tracing:
      enabled: true
      tempo_config:
        cache_enabled: true
        cache_capacity: 200
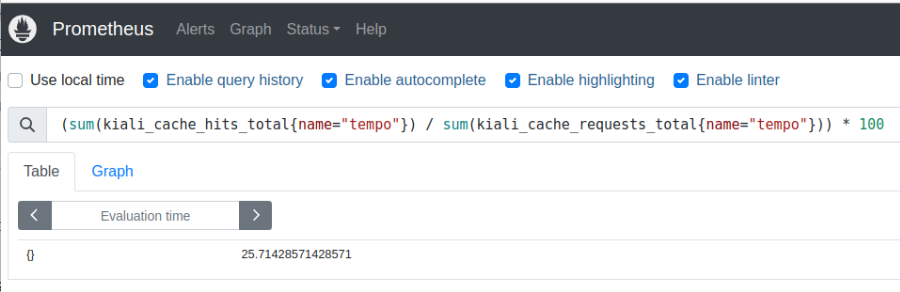
Kiali emits some cache metrics. The following query obtains the cache hit rate:
(sum(kiali_cache_hits_total{name="tempo"})/sum(kiali_cache_requests_total{name="tempo"})) * 100